Our Marketing Team at PopaDex
Using a 401k Growth Calculator to See Your Retirement Future

A 401k growth calculator is one of the most powerful tools in your retirement arsenal. It’s designed to do one thing brilliantly: take the abstract concept of your retirement savings and turn it into a clear, tangible projection of your future wealth. By plugging in a few key numbers—your salary, contributions, and expected returns—you can see the incredible long-term impact of compound interest on your investments.
This isn’t just about satisfying curiosity; it’s about giving yourself the data needed to make smarter financial decisions today.
From Guesswork to a Clear Financial Picture
Let’s be honest, staring at your quarterly 401k statement can feel a little disconnected from reality. You see a balance, you see contributions, and you see some market gains or losses. But connecting those numbers to what your life will actually look like in 20 or 30 years? That’s a massive mental leap.
This is exactly where a 401k growth calculator steps in. It bridges that gap, transforming abstract data into an actionable vision for your future.

Think of it less as a simple math equation and more as a dynamic forecasting tool. It’s built to bring the magic of compound interest to life. Seeing how your consistent savings can snowball over time is a huge motivational boost.
The Power of Visualization
When you can see a projection showing your balance potentially hitting $1 million, $2 million, or even more, the daily discipline of saving suddenly feels a lot more rewarding. This clear picture empowers you in a few key ways:
- Stay the Course: During the inevitable market slumps, having a long-term projection helps you remember that short-term volatility is just a blip on your journey.
- Make Smarter Decisions: You can instantly model the difference a small change makes. For example, see how bumping your contribution by just 1% could add tens or even hundreds of thousands of dollars to your final nest egg.
- Feel in Control: A lot of financial anxiety comes from uncertainty. A calculator replaces that unknown with a data-driven plan, giving you real confidence in your strategy.
Your 401k calculator is a perfect example of how interactive tools shift you from being a passive observer to an active participant in your own finances. Instead of just being told information, you’re actively shaping it, a concept explored in these powerful interactive marketing examples, including calculators. That shift is everything when it comes to owning your financial future.
Integrating Projections into Your Total Wealth
A 401k is often the cornerstone of a retirement plan, but it’s rarely the entire building. The real power of a 401k projection is unlocked when you place it within the context of your entire financial life. This is where a comprehensive net worth tracker like PopaDex becomes indispensable.
By pulling your 401k growth projection into a dashboard alongside your other assets—like real estate, brokerage accounts, and savings—you get a holistic view. You’re no longer just looking at one piece of the puzzle; you’re seeing the complete picture of your journey toward financial independence.
This integrated approach helps you see how all your assets are working in concert. You can spot gaps, recognize new opportunities, and make sure your 401k strategy is perfectly aligned with your broader wealth-building goals. The projection from a simple calculator evolves from a standalone number into a critical data point that informs your entire financial strategy for decades to come.
Gathering the Right Data for an Accurate Projection
Any 401k calculator is only as good as the numbers you feed it. Think of it like a recipe—if you use the wrong ingredients, you’re not going to like the result. To steer clear of the classic “garbage in, garbage out” problem, you need to pull together a few key pieces of information before you start crunching numbers. This is the only way to build a financial forecast you can actually count on.

This isn’t just a data-entry exercise. It’s about truly understanding the moving parts of your retirement savings engine. Each input works with the others to build momentum, and getting them right is the first crucial step toward a projection that means something.
Locating Your Core Financial Data
First up, let’s grab the essentials. These figures are the non-negotiable foundation for any calculation and are usually pretty easy to find. Just log into your 401k provider’s website or pull up your latest account statement.
Here’s the short list of what you need:
- Current 401k Balance: This is your starting line. What’s the total market value of your account right now?
- Your Annual Salary: Use your gross annual salary—the number before taxes or any other deductions are taken out. This is the baseline the calculator uses for your contributions.
- Your Contribution Percentage: What slice of each paycheck are you sending to your 401k? This percentage is one of the most powerful levers you have to change your long-term outcome.
Getting these three numbers right sets the stage for a smooth and accurate calculation.
Uncovering the Power of the Employer Match
Now, let’s talk about the accelerator: your employer match. This is easily the most powerful—and often most misunderstood—part of any 401k plan. It’s free money, plain and simple, and it dramatically juices your savings rate. Don’t guess on this one; you need the exact details.
Your company’s matching formula is usually spelled out in your employee benefits portal or the plan summary document. Look for phrases like:
- “We match 50% of your contributions up to 6% of your salary.”
- “We offer a dollar-for-dollar match on the first 3% you contribute.”
- “The company contributes a flat 3% of your salary, regardless of your contribution.”
A strong employer match is one of the best returns you can get on your money, instantly. Failing to contribute enough to get the full match is like turning down a guaranteed raise. Be precise with this input, as it will have a massive impact on your final projection.
The world of retirement savings has shifted quite a bit. Just a decade ago, in 2013, only 43% of workers who had a 401k plan were actually using it. Fast forward to 2023, and that number finally crossed the 50% milestone for the first time. The average employee contribution has climbed to 7.7% of pay, with employers kicking in an average of 4.6%. You can get the full story on this deep dive into 401k usage trends. This trend really drives home how critical it is to take full advantage of these plans.
Putting It All Together for a Solid Foundation
Once you’ve gathered these key figures, you’ve officially laid the groundwork for an accurate projection. You’re no longer operating on guesswork. Instead, you’re using real, personal data that reflects your financial reality today.
This preparation is what separates a vague, useless estimate from a powerful planning tool. With this solid foundation in place, you’re ready to tackle the more forward-looking inputs, like making smart assumptions about market growth and inflation.
Setting Smart Assumptions for Growth and Inflation
Okay, you’ve gathered all your current 401(k) data. Think of that as the fuel for your calculator. Now, we need to talk about the assumptions—this is the steering wheel.
Your assumptions about future growth and inflation will guide the entire projection. Even tiny tweaks here can lead to wildly different outcomes down the road. This is where we shift from hard numbers to making educated guesses, and getting it right is crucial for a forecast that’s actually useful.
Go too optimistic, and you might be planning for a fantasy retirement. Go too pessimistic, and you could stress yourself out for no reason. We’re aiming for a realistic middle ground that lines up with your investment strategy and what history has taught us.
Choosing a Realistic Rate of Return
This is the big one. Your estimated annual rate of return is the single most powerful number you’ll enter. It’s the average yearly growth you expect from your investments, and it absolutely shouldn’t be a random guess. It needs to reflect what you’re actually invested in.
Here’s a practical way to approach it:
- Aggressive Portfolios (mostly stocks): If your 401(k) is packed with stock funds like an S&P 500 index fund, you might look at the historical average, which is around 10%. But for planning your future, it’s smarter to dial that back. A more conservative assumption of 7% to 8% helps account for the inevitable down years and market volatility.
- Moderate Portfolios (a mix of stocks and bonds): Got a balanced fund or a 60/40 stock-to-bond mix? This approach is designed to smooth out the ride, which naturally means you won’t capture all the highs of a pure stock portfolio. A 5% to 6% average annual return is a solid, reasonable target here.
- Conservative Portfolios (mostly bonds and stable assets): If you’re nearing retirement, your focus has probably shifted from growth to protecting what you’ve built. For a portfolio heavy on bonds, an expected return in the 3% to 4% range is far more realistic.
A quick reality check: these are long-term averages. Your account will never grow by exactly 7% year after year. You’ll have amazing years, okay years, and some rough ones. The goal is that, over decades, they average out to the number you chose.
Factoring in the Silent Killer: Investment Fees
Hold on—before you lock in that growth rate, you have to deal with fees. Those little “expense ratios” you see on your fund statements are a direct drag on your performance. A fee of 0.50% or 1% might not sound like much, but over 30 or 40 years, the corrosive effect is staggering.
It’s not just a small drain; the Department of Labor has shown that even a 1% annual fee can wipe out hundreds of thousands of dollars from a saver’s final balance over a career.
To get a truly accurate projection, you need to calculate your net rate of return. It’s simple:
Calculation: Expected Gross Return - Annual Expense Ratio = Net Rate of Return for Calculator
So if you’re expecting an 8% average return but your funds have an average expense ratio of 0.75%, the number you should actually plug into the calculator is 7.25%. This small adjustment makes your forecast worlds more accurate.
Taming the Beast of Inflation
The last critical assumption is inflation. A million-dollar 401(k) balance sounds incredible, but what will a million dollars actually buy you in 30 years? Inflation is constantly eating away at your money’s purchasing power. If you ignore it, you’re planning for a cost of living that won’t exist.
Historically, the average inflation rate in the U.S. has hovered around 3%. It’s seen wild swings, but using 3% as a long-term estimate is a standard and sensible practice for retirement planning.
When a calculator adjusts for inflation, it’s showing you the future balance in today’s dollars. This is what truly matters. It helps you understand the actual lifestyle your savings can support. This idea is a cornerstone of financial planning, and you can dive deeper into the concept by exploring the future value of money and its implications. By entering a realistic inflation rate, you ensure the final number isn’t just an impressive figure, but a meaningful target for the retirement you actually want.
Running Scenarios to See Your Decisions in Action
Okay, you’ve gathered your numbers and made some smart assumptions. Now for the fun part: running scenarios with the 401k growth calculator. This is where the abstract numbers start telling a powerful story about your financial future. You get to see, in black and white, how small decisions today can create massive ripples decades from now.
The goal here isn’t to find one single “correct” number. It’s about exploring the possibilities and understanding the real-world impact of your choices. This process, often called scenario analysis in finance, turns vague financial ideas into concrete outcomes you can actually plan around.
Modeling Different Saver Profiles
Let’s walk through a few common situations to see how this plays out. Each example highlights how different life stages call for different strategies, and a calculator is the perfect tool to model them.
Scenario 1: The Early Starter (Age 25)
Someone just starting their career has one incredible advantage: time.
- Salary: $60,000
- Current Balance: $10,000
- Contribution: 8%
- Employer Match: 50% match up to 6%
- Net Rate of Return: 7.5% (8% growth - 0.5% fees)
- Retirement Age: 65
With a massive 40 years of compounding ahead, even modest contributions can snowball into a truly impressive sum. The calculator would likely project a final balance well over $1.5 million.
But what happens if they bump their contribution to 10%? That seemingly small change could easily add over $300,000 to their final nest egg. Seeing that firsthand makes sacrificing that extra coffee or takeout order feel incredibly worthwhile.
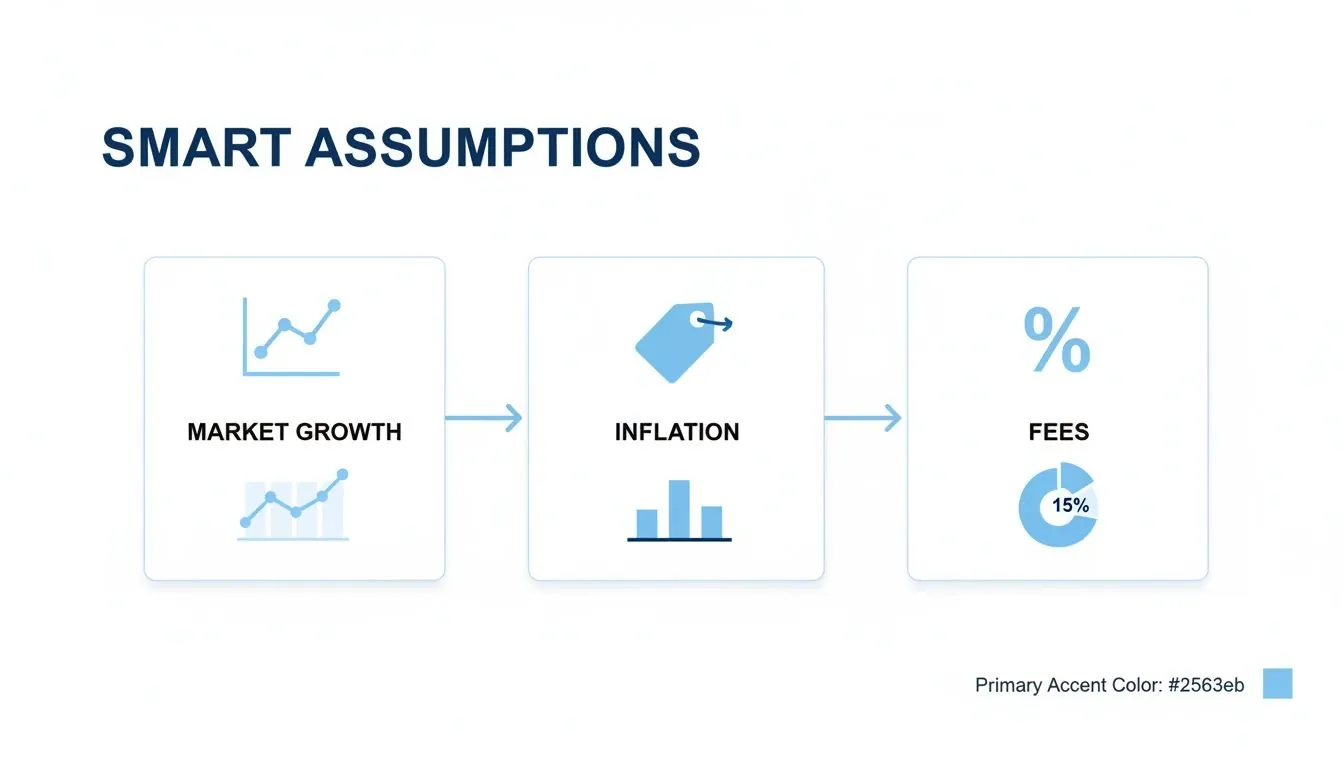
Each of these inputs—market growth, inflation, and fees—works together to shape a realistic retirement forecast.
The Power of Small Adjustments
It’s not just about your starting age. Tweaking your plan at any point can have an outsized impact over the long haul, which is the key insight you get from a 401k growth calculator.
Scenario 2: The Mid-Career Saver Playing Catch-Up (Age 40)
This person has less time but typically a higher income and a more substantial starting balance.
- Salary: $90,000
- Current Balance: $150,000
- Contribution: 12%
- Employer Match: 100% match up to 4%
- Net Rate of Return: 6.5% (assuming a more conservative mix)
- Retirement Age: 67
Here, the focus shifts to maximizing contributions. By running the numbers, they can see the direct financial benefit of delaying retirement by just a couple of years, which often adds a significant buffer to their nest egg. They can also model the powerful impact of making catch-up contributions once they hit age 50.
Running the numbers on a 401(k) growth calculator with historical averages shows the incredible power of compounding. If a 22-year-old contributes $20,500 annually and sees 8% growth, their $869,000 in total contributions could become over $6.4 million by age 65.
Scenario 3: The Final Stretch Fine-Tuner (Age 55)
For someone approaching the finish line, the calculator becomes less about aggressive growth and more about locking in certainty.
- Salary: $120,000
- Current Balance: $700,000
- Contribution: 15% (plus catch-up contributions)
- Employer Match: Flat 3% non-elective
- Net Rate of Return: 5.0% (focusing on capital preservation)
- Retirement Age: 65
This person can use the calculator to test how different rates of return affect their final balance, helping them decide if and when to de-risk their portfolio. This kind of modeling provides the confidence that their nest egg is truly ready for retirement. After running these projections, you can explore the big question—”do I have enough?”—with our https://popadex.com/retirement-nest-egg-calculator/.
Placing Your 401k Projections in Your Total Wealth Plan
After running a few scenarios through a 401(k) calculator, it’s easy to get fixated on that big final number. But treating that projection as the finish line is a mistake. Your 401(k), as powerful as it is, is just one piece of your complete financial picture.
To build real, lasting wealth, you have to place that projection into the broader context of your total net worth.
Think of it this way: your 401(k) might be the engine of your retirement vehicle, but you still need to account for the chassis (your home equity), the fuel tank (your liquid savings), and any extra cargo (brokerage accounts or other investments). Seeing them all together is where true financial clarity begins.
From a Single Account to a Full Balance Sheet
Most people only track their 401(k) by logging into their provider’s website. This siloed approach creates huge blind spots. You might have a fantastic 401(k) projection but be secretly weighed down by high-interest debt. Or maybe you have a pile of cash in a savings account that isn’t working nearly hard enough for you.
This is where a dedicated net worth tracker like PopaDex completely changes the game. By pulling all your financial data into a single dashboard, you stop managing separate accounts and start steering your entire financial life.
Your 401(k) projection transforms from a static number into a dynamic piece of your total wealth plan. This integrated view is what allows you to make much smarter, more coordinated decisions with your money.
A holistic financial view isn’t a luxury; it’s a necessity for effective planning. When you can see how your 401(k) growth interacts with your other assets and liabilities, you can make strategic choices that accelerate your journey to financial independence.
A good tracker shows you how to consolidate all your different accounts, including your projected 401(k) growth, for a unified view. This gives you the power to see your real-time net worth and understand exactly how your retirement savings contribute to the bigger picture.
Holistic Wealth Tracking Beyond the 401(k)
Tracking your 401(k) by itself gives you a narrow, and often misleading, view of your financial health. Integrating it into a full net worth picture provides the context needed for smart decision-making.
| Feature | Isolated 401(k) View | Integrated Net Worth View (PopaDex) |
|---|---|---|
| Financial Clarity | Shows only retirement savings growth. | Reveals the full picture of assets vs. liabilities. |
| Debt Context | Ignores high-interest debt that can negate gains. | Puts investment gains in context with debt obligations. |
| Asset Allocation | Limited to investments within the 401(k) plan. | Provides a total portfolio view across all accounts. |
| Decision-Making | Leads to isolated choices about contributions. | Enables strategic decisions, like paying off debt vs. investing. |
| Goal Tracking | Tracks progress toward a single retirement number. | Aligns all financial efforts toward multiple goals (FI, home, etc.). |
The integrated approach moves you from being a simple account holder to the CFO of your own life.
Making Smarter Decisions with a Complete View
When you have a complete picture of your wealth, your planning becomes exponentially more effective. You can finally answer the critical questions that a 401(k) statement alone can’t.
- Asset Allocation: Is your overall portfolio too heavily weighted in stocks, or do you need more diversification outside your 401(k)?
- Liquidity: Do you have enough cash for emergencies, or is too much of your wealth locked up in retirement accounts?
- Debt Management: How does your 20% credit card debt stack up against your investment gains? A full view makes it obvious whether you should pay down debt or invest more.
Consider the real-world growth of retirement accounts. Imagine starting your 401(k) journey in 2019 with a modest balance of around $82,000, only to watch it grow to $148,000 by the end of 2023. That’s a compound annual growth rate of an impressive 15.8%. For young professionals or expats tracking multi-currency portfolios on platforms like PopaDex, simulating these growth trajectories in one dashboard demystifies retirement planning. It shows how even modest weekly investments can compound into life-changing wealth. You can discover more insights about these 401(k) growth trends on PlanAdviser.com.
Building Your Comprehensive Roadmap
Using a 401(k) growth calculator is the first step. The next, more important step is to integrate that projection into a living, breathing financial plan. This is how a simple forecast becomes a strategic roadmap.
- Establish a Baseline: Start by adding all your assets (savings, investments, property) and liabilities (mortgage, loans) to a tracker. This gives you your current, real-world net worth.
- Incorporate Your Projection: Add your projected 401(k) balance as a long-term goal or future asset. This helps you visualize its powerful impact on your future net worth.
- Track and Adjust: Make it a habit to update your net worth monthly and revisit your 401(k) projections annually. This allows you to course-correct as your income, goals, or market conditions inevitably change.
This process transforms you from a passive saver into an active architect of your financial future. And as you get closer to retirement, you can use more specialized tools to plan your next steps. For a detailed look at how to turn your nest egg into a steady stream of cash, check out our guide on using a retirement income calculator. By combining these tools, you build a complete and resilient plan for long-term financial freedom.
Common Questions About 401k Calculators
Even with all the inputs sorted out, you might still have a few questions rattling around. And that’s perfectly normal. Using a 401k growth calculator is a huge step toward grabbing the reins of your financial future, and you should feel completely confident in the process.
Let’s walk through some of the most common questions people have when they start projecting their retirement savings. Getting these answers will help you use the tool more effectively and, more importantly, trust the numbers you see.
How Often Should I Recalculate My 401k Growth?
It’s tempting to plug in new numbers every time the market has a good—or bad—week, but that’s a recipe for unnecessary anxiety. Remember, this calculator is a long-term strategic tool, not a crystal ball for short-term market timing.
A great rhythm is to run your numbers once a year. Think of it as an annual financial check-up to see if you’re on track and make small course corrections. You should also definitely revisit the calculator after any major life change:
- You get a raise or promotion. This is the perfect time to see how bumping up your contribution percentage can supercharge your future balance.
- You change jobs. A new role almost always means a different salary and, crucially, a new employer matching formula to factor in.
- Your financial goals shift. If you suddenly decide you want to retire five years earlier (or later), the calculator can show you exactly what it’ll take to make that happen.
What Is a Realistic Rate of Return to Assume?
This is probably the single most important question, since the rate of return you choose has a massive impact on your final projection. The right answer really depends on your investment mix and how much risk you’re comfortable with.
While historical market averages can look excitingly high, it’s always smarter to be conservative when you’re planning for the future. As a solid rule of thumb, assuming a 6% to 8% average annual return is a reasonable starting point for a diversified portfolio of stocks and bonds.
If your 401k is invested aggressively (think mostly stock index funds), you might feel comfortable leaning toward the higher end of that range. If your allocation is more conservative (with a healthy chunk in bonds), using 5% to 6% is probably more realistic. Just always remember the golden rule: past performance is never a guarantee of future results.
Don’t forget about fees! The Department of Labor makes it clear that even a 1% fee can take a huge bite out of your savings over a few decades. For a much more accurate projection, subtract your plan’s annual fees from your expected return. So, if you assume 7% growth and your fees are 0.5%, plug 6.5% into the calculator.
Can This Calculator Work for an IRA or Other Accounts?
Absolutely. While we call it a “401k” calculator, the powerful math behind compound interest works the same everywhere. You can use this exact framework to project the growth of just about any investment account, whether it’s a Roth IRA, a Traditional IRA, or a taxable brokerage account.
You’ll just need to tweak the inputs to fit the account:
- Employer Match: Simply set this to zero for any non-401k account.
- Contributions: Be sure to follow the specific annual contribution limits for IRAs, which are much lower than the limits for 401ks.
This is exactly why a tool that tracks your entire net worth is so powerful. It lets you see the projected growth of all your accounts in one place, giving you the complete picture of your financial future, not just one piece of it.
How Should I Interpret the Final Number?
That big number the calculator spits out isn’t a promise—it’s a projection. It’s a guidepost, not a guarantee, and its real value is in helping you answer the tough strategic questions.
- Is my current savings rate enough? If the final number falls short of what you need for retirement, you know it’s time to increase your contributions.
- What if I work just a few more years? You can instantly see the incredible financial impact of delaying retirement.
- How much do I need to save? Instead of guessing, you can work backward to figure out the exact contribution rate you need to hit your goal.
Ultimately, the calculator’s output provides the data-driven clarity you need to make confident financial decisions today that will pay off for decades to come.
Ready to stop guessing and start planning? The first step is seeing all your accounts in one place. PopaDex gives you the tools to track your total net worth and turn your financial goals into an actionable plan. Start your free trial today and build your financial future with confidence at https://popadex.com.