Our Marketing Team at PopaDex
Calculate Future Value of Money for Growth

Figuring out the future value of your money is all about projecting how much a chunk of cash today will grow over time, assuming a certain rate of return. It’s the core idea that turns your current savings into future wealth, giving you a tangible number to aim for with your investments.
Your Guide to Financial Forecasting
Ever wonder what your savings could look like in five, ten, or even twenty years? That’s not just wishful thinking; it’s the power of calculating future value (FV). This isn’t some dry, academic exercise—it’s a seriously practical tool for mapping out your biggest life goals, whether that’s a down payment on a house or a comfortable retirement.
This calculation takes your abstract financial goals and turns them into concrete, achievable numbers. Once you really grasp that money today has the potential to grow, you’ve got a massive advantage in your financial planning.
The Power of Compounding Growth
At its core, calculating future value hinges on the magic of compound interest. Just look at the U.S. stock market. The S&P 500 has delivered an average annualized return of around 9.35% over the last 150 years. This shows how even modest returns can snowball when given enough time.
This screenshot perfectly illustrates the exponential growth curve you get when interest is compounded over time.

The chart makes it obvious: the longer your money stays invested, the more dramatically it grows. Why? Because you start earning returns on your previous returns.
Turning Projections into Reality
Solid financial forecasting is what makes ambitious goals feel possible. It can show you exactly how to build significant wealth throughout your career, which is the bedrock of planning for those major life events. For instance, if you’re trying to figure out how to retire at 55 with $2 million, you absolutely need a detailed plan based on future value.
Understanding future value gives you a clear roadmap. Instead of just saving aimlessly, you can set specific targets and know exactly what it will take to reach them. It empowers you to take real control of your financial destiny.
Ultimately, learning to calculate the future value of your money is about making your money work harder for you. Now, let’s get into the nitty-gritty of how to put this powerful concept into practice.
Understanding the Future Value Formula
Before you can really start projecting your money’s growth, you need to get familiar with the engine behind it all: the Future Value formula. It might look a little intimidating at first glance, like something out of a finance textbook, but it’s actually quite straightforward once you see what’s under the hood.
The classic formula for a single, lump-sum investment is: FV = PV * (1 + r)^n
Don’t think of it as just math. Think of it as a recipe for growing your money. Each ingredient plays a crucial part in the final result.
Decoding Each Variable
Let’s break down the “ingredients” that power this calculation. Getting a handle on what each variable represents is the key to using the formula for your own financial planning.
- Present Value (PV): This is your starting point—the initial lump sum of money you’re investing. It’s the seed capital you plant today.
- Interest Rate (r): This is the rate of return you expect to earn on your investment each period, and you’ll always want to express it as a decimal (so 7% becomes 0.07). Think of it as the sunlight and water that helps your initial investment grow.
- Number of Periods (n): This represents how long your money will be invested, usually counted in years. It’s the time you give your investment to mature and do its work.
The real magic in this formula comes from compound interest. This is the phenomenon where your investment starts to generate earnings on its previous earnings, causing your growth to accelerate dramatically over time.
For instance, say you invest $1,000 (PV) for 10 years (n) at an annual interest rate of 7% (r). Your money doesn’t just grow by a flat $70 each year. In the second year, it grows by 7% of $1,070, then 7% of that new total the next year, and so on. This compounding effect is the secret sauce to building significant wealth.
To help you get comfortable with these terms, here’s a quick reference table breaking down each component of the Future Value formula.
Future Value Formula Components Explained
| Variable | What It Means | Example |
|---|---|---|
| FV (Future Value) | The total amount your investment will be worth at the end of the term. | The final balance you’ll have after 10 years. |
| PV (Present Value) | The initial amount of money you are investing right now. | The $1,000 you deposit into an account today. |
| r (Interest Rate) | The annual growth rate of your investment, as a decimal. | A 7% annual return is written as 0.07 in the formula. |
| n (Number of Periods) | The total number of years (or other periods) the money is invested. | An investment held for 10 years. |
Understanding these pieces transforms the formula from an abstract equation into a practical tool for mapping out your financial future.
The interest rate (r) is usually the trickiest variable to pin down. It’s influenced by the type of investment you choose, current market conditions, and your personal tolerance for risk. To get a better handle on this critical number, you can learn more about how to calculate the rate of return for different assets.
Putting the Future Value Formula Into Practice
Theory is great, but let’s be real—the magic happens when you see the numbers in action. We’ll walk through two classic scenarios to show you how future value works, first with a simple one-time investment and then with the more common approach of making regular contributions.
This is where your initial investment starts its journey toward becoming future wealth.
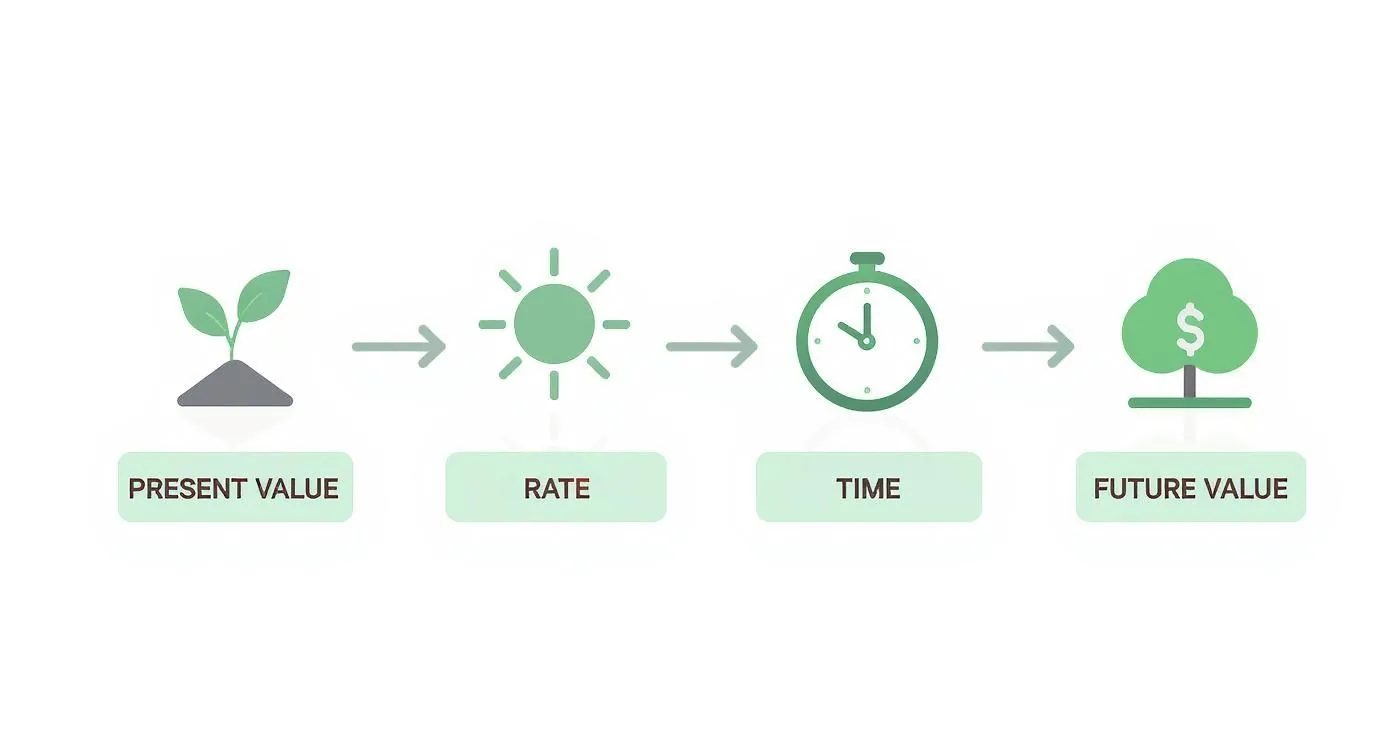
As you can see, your starting cash, the growth rate, and time are the three key ingredients. Each one plays a huge part in how much your money will grow.
Example 1: The One-Time Investment
Let’s say you get a $5,000 bonus from work and decide to invest it for 10 years. You’re hoping for an average annual return of 7%. Using the formula FV = PV * (1 + r)^n, here’s how the math breaks down:
- PV (Present Value) = $5,000
- r (Rate) = 0.07 (which is just 7% as a decimal)
- n (Number of periods) = 10 (years)
When you plug those numbers into the formula, you get: FV = $5,000 * (1 + 0.07)^10.
Working it out, (1.07)^10 comes to about 1.967. Multiply that by your initial investment ($5,000 * 1.967), and you get $9,835. In just ten years, your one-time investment could nearly double without you lifting another finger.
Example 2: Consistent Monthly Savings
Now for a scenario that’s probably more familiar. Imagine you decide to save $200 every single month in an investment account that also earns an average of 7% a year. The formula for this is a bit more complex since it has to account for all those regular payments, but thankfully, we have tools to do the heavy lifting.
Spreadsheets are your best friend here. In Google Sheets or Excel, the =FV function is a lifesaver. For this scenario, you’d type in: =FV(0.07/12, 10*12, -200).
After a decade of those consistent contributions, your account’s future value would be around $34,625. You personally put in $24,000 ($200 x 120 months), which means you earned over $10,600 just from growth. That’s the power of compounding in action.
While formulas are perfect for mapping things out, you need a way to track your actual progress. A solid investment tracking spreadsheet is non-negotiable for making sure your real-world returns are lining up with your goals. Keeping good records helps you spot when you need to make adjustments to stay on track.
The ideas behind these calculations pop up all over finance. For example, learning how to calculate ROI on rental property uses very similar concepts of projecting financial growth. Both skills require you to forecast future returns from today’s investments, making them incredibly valuable for any investor.
Accounting for Real-World Investment Factors

A simple formula is a great starting point, but let’s be honest—real-world investing is never that clean. If you really want to calculate the future value of money with any accuracy, you have to account for the forces that are constantly trying to chip away at your returns.
Think of them as financial headwinds. They won’t stop you from reaching your destination, but you absolutely need to factor them in. The usual suspects are:
- Inflation: The silent killer of wealth. A 7% return looks great on paper, but if inflation is running at 3%, your real return is only 4%.
- Taxes: Capital gains and dividend taxes can take a hefty bite out of your earnings, shrinking the pot of money you have left to reinvest.
- Fees: Whether it’s advisory fees, fund expense ratios, or trading commissions, these costs add up and directly lower your net returns.
Beyond Generic Return Rates
Plugging a generic 7% or 8% into your calculation is one of the most common mistakes I see. The truth is, your expected return is completely tied to where and how you invest. A 7% return in one market is not the same as a 7% return somewhere else.
Global markets are a perfect example. Research digging into historical data from 39 countries found that the United States delivered the highest uninterrupted real equity return at roughly 4.73% per year. In stark contrast, the median real return in other countries hovered around just 1.5% annually. That’s a massive difference that would completely change your final number. You can discover more insights about these global stock market findings to see the full picture for yourself.
This highlights a critical lesson for investors: your assumed rate of return must be grounded in reality. The best way to do this is by looking at the historical performance of the specific assets you plan to invest in.
To find more realistic growth rates, look up the long-term historical data for your chosen assets—think the S&P 500 for US stocks or specific bond indices for fixed income. This data-driven approach shifts you from pure guesswork to informed forecasting.
Getting a handle on these nuances is also a key part of learning how to diversify an investment portfolio effectively. It forces you to look at performance across different asset classes and regions, helping you build a much more resilient financial plan with achievable goals.
How Market Volatility Impacts Your Forecast
So, markets go up and they go down—how does that messy reality fit into the clean little formula we’ve been using? It’s a huge deal. The ‘r’ for rate in our future value calculation is always an average annual return, not a guarantee you’ll hit year after year.
That distinction is everything because real-world returns can swing wildly. Just look at recent history. The S&P 500’s annual returns between 2015 and 2024 bounced from a gut-wrenching low of -18.1% in 2022 to an incredible high of 31.5% in 2019. You can see the year-by-year swings for yourself, and it paints a clear picture of how unpredictable the short term can be.
This is exactly why your investment timeline is so important.
Adjusting Your Rate for Different Time Horizons
For long-term goals, this short-term noise has a way of evening itself out. The peaks and valleys have time to balance, which is why using a long-term average is a perfectly sound strategy for something like retirement planning decades down the road.
But for shorter-term goals, you have to change your approach.
A goal that’s only three to five years away is too close for comfort to rely on a high average stock market return. One bad year could completely derail your plans. For shorter timelines, you have to be more conservative with the growth rate you plug into your calculations.
Here’s a practical way I think about adjusting the expected rate of return based on how soon you need the money:
- Long-Term Goals (10+ years): Using a historical average like 7-8% for a diversified stock portfolio is a reasonable place to start. There’s enough time to ride out the bumps.
- Medium-Term Goals (5-10 years): I’d dial it back. Consider a more blended and conservative rate, maybe 4-6%, assuming you have a mix of stocks and less volatile bonds.
- Short-Term Goals (Under 5 years): For money you know you’ll need soon, safety is the priority. A very conservative rate of 1-3%, reflecting what you’d get from a high-yield savings account or CD, is much smarter.
When you tailor your assumed rate of return to your specific time horizon, your future value forecast stops being a simple math problem and becomes a far more reliable, actionable tool for your real-life financial plans.
Getting to Grips with Future Value: Your Questions Answered
Even when you feel you have the formula down, a few questions tend to crop up. Let’s walk through some of the most common ones I hear, so you can move forward with your financial planning with total confidence.
What’s the Real Difference Between Future Value and Present Value?
Think of them as two sides of the same coin, each looking at your money from a different point in time.
Future Value (FV) is all about projection. It takes a sum you have today—say, $1,000—and calculates what it could grow into over a set period, like 10 years. It answers the question, “What will this be worth later?”
Present Value (PV) works in reverse. It tells you what a future amount of money is worth in today’s dollars. It helps you figure out, “How much do I need to invest right now to have $10,000 in 10 years?” Both are absolutely essential for making smart financial moves.
How Much Does Compounding Frequency Actually Matter?
It matters—a lot. Compounding frequency is the secret sauce that can dramatically accelerate your investment’s growth.
When interest compounds annually, it’s calculated and added to your balance just once a year. But if it compounds monthly, your interest starts earning its own interest twelve times a year. This creates a snowball effect.
The more frequently your investment compounds, the faster it grows. An account that compounds daily will always outperform one that compounds annually, even if they have the exact same interest rate on paper.
Over a long enough timeline, this seemingly small detail can mean thousands of extra dollars in your pocket.
Can I Really Use the FV Formula for Stocks?
This is a great question, and the answer has a bit of nuance. The standard FV formula is built for a fixed, predictable interest rate, which is the opposite of the stock market’s day-to-day reality. So, you can’t use it for a precise, year-by-year prediction.
However, it’s an incredibly useful tool for long-term forecasting. By plugging in an estimated average annual return—like the historical average of 7% for the S&P 500—you can create a solid long-range projection. For a more granular analysis with fluctuating returns, you’d want to map out the growth for each period in a spreadsheet.
Bringing these calculations into your real-world financial picture is where the magic happens. With PopaDex, you can track every investment, savings account, and asset in one place. This allows you to see how your future value projections are lining up with your actual, real-time net worth. Take control of your financial journey and start tracking your progress at https://popadex.com.