Our Marketing Team at PopaDex
Calculate Rate of Return Like a Pro
At its core, calculating the rate of return is pretty simple. You take the final value of your investment, subtract what you originally paid for it, and then divide that difference by your initial cost. This gives you a percentage that quickly tells you how much profit—or loss—you’ve made relative to what you put in.
What Rate of Return Actually Tells You
Calculating your rate of return (RoR) is about more than just crunching numbers; it’s about gaining real clarity on your financial journey. Think of it as the universal language for measuring how effectively your money is working for you, no matter where it’s invested.
This is where its real power lies. RoR lets you compare completely different investments on an equal footing. Is that trendy tech stock actually outperforming your rental property? A quick RoR calculation gives you the definitive answer. This is why just glancing at your account balance can be so misleading. Sure, the balance might have gone up, but RoR reveals how efficiently it got there.
Key Takeaway: Rate of Return is more than another metric; it’s a vital performance indicator. It measures the growth of your capital, not just the final dollar amount, giving you a true sense of your investment’s success.
This one powerful percentage cuts through all the noise. It gives you a standardized way to measure performance, helping you figure out if your strategy is actually working and providing a much clearer picture of your financial standing.
While RoR is a crucial part of your financial toolkit, it’s just one piece of a much larger puzzle. To see how it fits into your overall financial picture, it helps to understand how to calculate your net worth. Ultimately, mastering these concepts empowers you to make smarter, more confident financial decisions.
The Simple Return Formula Unpacked

Before you get lost in complex financial analysis, it’s best to get a solid grip on the basics. At its core, the formula for calculating an investment’s rate of return is refreshingly simple. It’s the foundation for almost every other kind of investment analysis, and once you get it, you’ll feel much more confident.
The formula is just this: (Current Value - Initial Value) / Initial Value
Let’s walk through it with a real-world scenario. Imagine you bought a single share of a popular tech company for $150. That’s your Initial Value. Fast forward a year, and you see that same share is now trading at $180—its Current Value.
Calculating Your Gain
So, how much did you make? Simply subtract what you paid from what it’s worth now: $180 - $150 gives you a $30 net gain.
To figure out your rate of return, you just divide that profit by your original cost: $30 / $150 = 0.20.
Multiply that number by 100 to get a percentage, and there you have it. Your simple rate of return is 20%. This one number tells you exactly how much your money grew relative to what you put in.
Of course, investing isn’t always a straight line up. For context, the S&P 500’s average annual return over the last decade was around 13.3%. But within that period, individual years swung wildly from a loss of -18.1% to a gain of +31.5%. This shows why looking at returns over different timeframes is so important to get the full story.
Pro Tip: This basic formula is the perfect starting point, but it doesn’t factor in things like dividends or the time value of money. For that, you’ll need to step up to more advanced methods.
This calculation is the first big step toward taking real control of your portfolio. Another key piece of the puzzle is understanding how your returns can grow on themselves over time. A great resource for that is this guide on the Compound Interest Formula Explained Simply, which builds directly on what you’ve just learned.
Applying Return Calculations to Your Portfolio
Alright, let’s move from theory to real-world investing. Your portfolio is a living, breathing thing—it’s rarely as simple as buying one stock and holding it for a year. You’ve got dividends trickling in, multiple assets doing their own thing, and different time horizons to juggle. All of these moving parts need to be factored in if you want a true picture of your returns.
Let’s kick things off with a common scenario: a dividend-paying stock. Say you bought shares for $2,000. A year later, the stock’s value has climbed to $2,100, and along the way, you pocketed $50 in dividends. To get your total return, you absolutely must include that dividend income.
Your total gain goes beyond the price increase; it’s ($2,100 - $2,000) + $50, which comes out to $150. That makes your total return a solid 7.5%.
This image breaks down that exact flow, from your initial investment to your final return percentage.
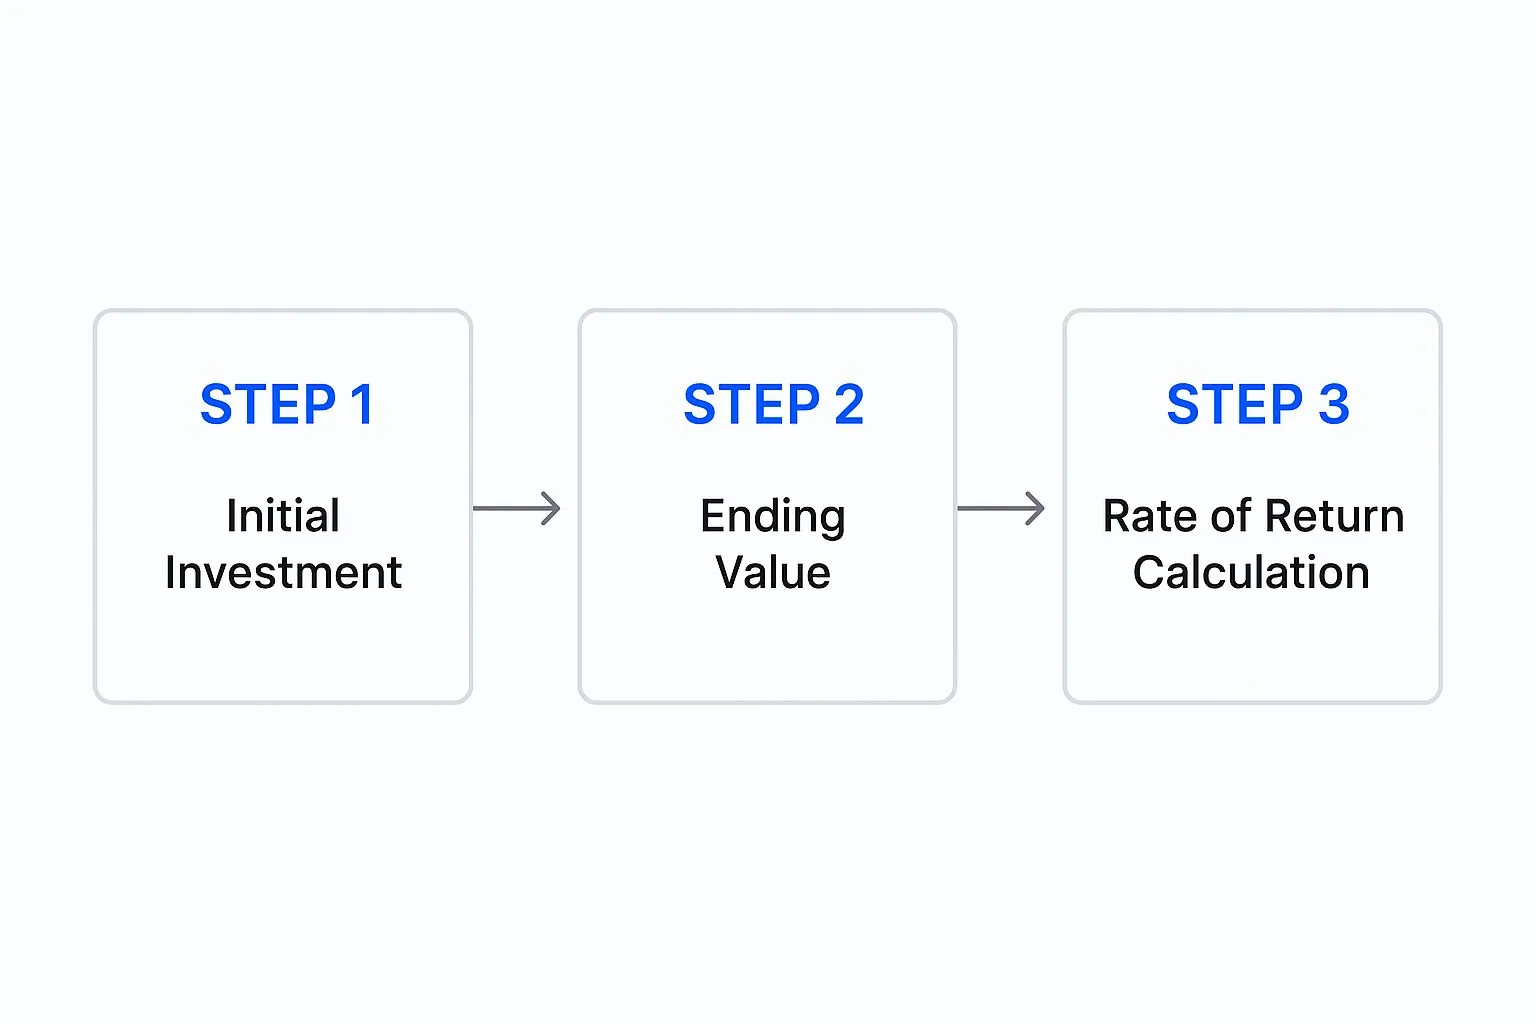
As you can see, figuring out your return is a clear journey: know where you started, track where you ended up (including all gains), and then calculate what that change means as a percentage. It’s that simple.
Annualizing Returns for Better Comparisons
But what about investments you’ve held for several years? A 20% return over three years sounds great, but how does it stack up against a 10% return you made in just one year? It’s a bit like comparing apples and oranges. This is precisely where annualizing your return becomes a game-changer. It standardizes your total return into an equivalent yearly figure, so you can make direct, meaningful comparisons.
Just look at the U.S. stock market. Since 1957, the S&P 500 has delivered an average annual return of around 8.00%. But if you zoom in on a more recent 10-year period, that average jumps to 11.01%. It’s a perfect example of how different timeframes tell different stories. Understanding these long-term trends is key to setting realistic expectations for your own portfolio.
Key Takeaway: Always count every form of income, like dividends. And for investments held over different time periods, annualize the returns. It’s the only way to get a true, honest measure of performance across your entire portfolio.
Once you have these numbers crunched, the real fun begins: seeing how your portfolio measures up. Using powerful portfolio analysis tools automates all these tricky calculations, giving you a crystal-clear view of your financial progress. Marrying this data with proven long-term investing strategies is what separates wishful thinking from building real, sustainable wealth.
Forces That Shape Your Actual Returns

The rate of return you see on paper rarely tells the whole story. Your investments don’t operate in a vacuum; several powerful, often invisible, forces are constantly at work, either boosting your gains or quietly eroding them. To really understand what your money is doing, you have to look beyond that initial number.
The most common culprit is inflation. The return printed on your statement is your nominal return, but what truly matters is your real return—what’s left after you account for the rising cost of living. For instance, if your investment portfolio grew by 7% last year but inflation was 3%, your actual purchasing power only increased by 4%.
The Hidden Costs of Investing
Beyond inflation, a handful of other costs can take a significant bite out of your profits. These “leaks” might seem small at first, but they compound over time and can seriously drag down your final rate of return.
Keep an eye out for these common deductions:
- Transaction Fees: Brokerage commissions for buying and selling assets can chip away at both your initial investment and your final take-home amount.
- Taxes: Capital gains taxes can significantly reduce your profits, with the final bill depending on your tax bracket and how long you held the asset.
- Account Maintenance Fees: Some platforms charge annual or quarterly fees just to keep your account open, creating a direct drag on your performance.
Key Insight: Your real return is the only number that truly matters for your long-term financial health. It’s the measure of your portfolio’s ability to grow your wealth beyond the rising cost of living.
Geopolitical stability also plays a surprisingly large role. A century-long study from the National Bureau of Economic Research found that the U.S. stock market delivered an inflation-adjusted real return of 4.73% annually throughout the 20th century. This figure dwarfed the median of 1.5% seen in many other countries that faced significant instability.
Ultimately, when you calculate rate of return, you have to look past the surface-level number. Factoring in inflation, fees, and taxes gives you a much more honest and actionable picture of how your investments are actually performing.
Ditching the Spreadsheet: Why PopaDex is the Smarter Way to Track Returns
Calculating your rate of return in a spreadsheet is a great starting point. But let’s be honest, once you start factoring in multiple accounts, regular contributions, and reinvested dividends, that “simple” spreadsheet gets complicated—fast. It becomes a chore, and worse, it’s dangerously easy to make a costly mistake.
This is exactly why smart investors move beyond manual tracking. A modern tool like PopaDex is built to handle all that complexity for you. Forget trying to remember every single transaction or fee. PopaDex automates the whole process, giving you a real-time, accurate picture of your portfolio’s health without the headache.
Get True Portfolio Intelligence, Not Just Numbers
The real win here goes beyond saving time. It’s about getting much deeper insights. An automated platform can effortlessly run advanced calculations like the time-weighted return (TWR), which is the gold standard for measuring performance, especially when you’re adding or withdrawing money.
TWR strips away the distorting effects of your cash flows, so you can see how well your underlying investment strategy is actually performing. It answers the question, “Is my investment mix working?” without getting sidetracked by when you moved money around.
Key Takeaway: Automating your return calculations isn’t a shortcut; it’s an upgrade. It frees you from tedious math so you can focus on what really matters: making smart, strategic decisions about your financial future.
This dashboard view from PopaDex shows exactly how your return data comes to life, turning complex information into something you can understand at a glance.
The platform lays out your overall portfolio performance clearly. You can immediately see how you’re growing and pinpoint which assets are doing the heavy lifting.
By centralizing your entire financial world—from bank accounts to investment portfolios—PopaDex gives you the power to:
- Track Performance on Autopilot: See your true rate of return updated constantly, with zero manual entry.
- Prevent Costly Errors: Ditch the risk of broken spreadsheet formulas and typos that could lead to bad decisions.
- Focus on Strategy, Not Spreadsheets: Spend your valuable time analyzing your results and planning your next move, not calculating numbers.
Common Questions About Investment Returns
As you start digging into your investment performance, you’ll find the same questions tend to crop up. Getting clear, practical answers is the first step toward building confidence and making smarter choices with your money. Let’s break down a few of the most common ones I hear from investors.
What Is a Good Rate of Return?
This is the million-dollar question, and the honest answer is: it’s all relative. For a lot of people, a “good” return simply means beating a major benchmark like the S&P 500, which has historically delivered around 10% per year. At a bare minimum, you want to be beating the rate of inflation.
But the best answer really depends on your personal financial goals and how much risk you’re comfortable with. An aggressive investor chasing growth might be aiming for 15% or more. On the other hand, someone nearing retirement might be thrilled with a stable 6-8% that focuses on preserving their capital. If you’re still figuring this out, our guide on financial planning for beginners is a great place to start setting some realistic targets.
Key Insight: A “good” return isn’t about chasing the highest possible number. It’s about finding the return that meets your specific financial goals while letting you sleep at night.
Is Rate of Return the Same as ROI?
You’ll often see these terms used interchangeably, but there’s a subtle but important distinction. Rate of Return (RoR) is a broad term that measures the gain or loss on any investment over a specific period. It’s perfect for tracking the ongoing performance of your entire portfolio.
Return on Investment (ROI), however, is typically used to judge the profitability of a single, distinct investment from its beginning to its end. Think of calculating the ROI on a kitchen remodel before selling a house or on a single stock you bought and sold. RoR is for the big picture; ROI is for specific projects.
How Do I Calculate Returns on a Loss?
The great thing about the formula is that it works the exact same way, even when an investment doesn’t go your way. If the current value of your investment is less than what you originally paid, the math will simply produce a negative number.
For example, say you invested $1,000 and its value has dropped to $800. The calculation would be ($800 - $1,000) / $1,000. This gives you a rate of return of -20%, accurately reflecting the loss on your investment. No need for a separate formula—the numbers tell the story.
Ready to move past manual calculations and get a true, real-time picture of your portfolio’s performance? PopaDex automates everything, factoring in fees, dividends, and cash flows to give you the clarity you need to invest with confidence. See how it works at https://popadex.com.