Our Marketing Team at PopaDex
Master Your Debt to Asset Ratio Calculation

Before you can really use the debt to asset ratio calculation to your advantage, you have to understand the story it tells. The formula itself is dead simple: just divide a company’s total liabilities by its total assets. But that single number reveals how much of a company’s world is built on borrowed money versus its own resources.
What the Debt to Asset Ratio Really Tells You

Before you even glance at a balance sheet, it’s worth taking a moment to wrap your head around the core idea. Think of the debt-to-asset ratio as a powerful lens for viewing a company’s financial stability—or lack thereof. It gets right to the point, answering one crucial question: “For every dollar of assets the company owns, how much of it is financed by someone else?”
This isn’t some abstract financial exercise. It’s a fundamental health check for anyone trying to understand a business. Whether you’re an investor looking for your next big win, a lender sizing up a loan application, or a business owner keeping a close eye on your own books, this ratio gives you a clear snapshot of financial leverage. It’s a foundational metric in any sound approach to financial planning for beginners and a go-to for seasoned analysts.
Decoding the Story Behind the Number
So, what does the result actually mean in the real world?
A high ratio is a red flag that a company is leaning heavily on debt to fund its growth. This isn’t always a bad thing—it can supercharge profits when business is booming. But it also dials up the risk. If that company hits a rough patch, those hefty debt payments can quickly become an anchor dragging it down.
On the flip side, a low ratio usually points to a more conservative, self-sufficient financial footing.
Essentially, the debt-to-asset ratio measures the slice of a company’s assets that are paid for with borrowed money. For instance, if a company has $500 million in assets and $200 million in liabilities, its debt-to-asset ratio is 0.4, or 40%. A higher number signals more reliance on debt, which can be risky, while a lower one suggests a company is on more solid ground.
Key Takeaway: Picture a financial scale. On one side, you have everything the company owns (assets). On the other, you have everything it owes (liabilities). This ratio tells you which side is tipping the scale and by how much.
The Two Core Components of the Formula
To get this calculation right, you’ll need to pull two key numbers from a company’s balance sheet. They are the bedrock of this entire analysis.
To make it easy, here’s a quick breakdown of what you’re looking for and where you’ll typically find it.
Core Components for Your Calculation
| Component | What It Includes | Where to Find It | | :— | :— | :— | | Total Liabilities | All of the company’s debts. This covers short-term obligations like unpaid bills and salaries, plus long-term debt like bank loans and bonds. | Under the “Liabilities” section of the balance sheet. | | Total Assets | Everything of value the company owns. This includes current assets like cash and inventory, and non-current assets like property and equipment. | Under the “Assets” section of the balance sheet. |
Once you have these two figures, the hard part is over. The rest is just simple division.
Finding the Right Numbers on the Balance Sheet
To get an accurate debt to asset ratio calculation, you have to start with the right ingredients. That means digging into a company’s balance sheet, which is the official scorecard of its financial health. The entire analysis hinges on correctly identifying two key figures: total assets and total liabilities.
Think of the balance sheet as being split into two fundamental sides. On one side, you have everything the company owns—its assets. On the other, you have everything it owes—its liabilities—plus the owners’ stake, which is shareholder equity. Your job is to grab the grand total from the first two categories.
Locating Total Assets
First up, you need to pinpoint the total assets line item. This number represents the sum of everything of economic value the company has in its possession. It’s not just a single figure but a combination of different types of assets.
You’ll see assets broken down into a couple of main groups:
- Current Assets: These are things the company expects to turn into cash or use up within a year. We’re talking about cash in the bank, accounts receivable (money owed by customers), and inventory sitting in the warehouse.
- Non-Current Assets: These are the long-haul investments that aren’t easily converted to cash. This bucket includes big-ticket items like property, plant, and equipment (PP&E), long-term investments in other companies, and even intangible assets like patents or trademarks.
Add these two groups together, and you’ve got your total assets. Luckily, on any standard balance sheet, this is almost always a clearly labeled subtotal, making it pretty easy to spot.
Identifying Total Liabilities
Next, you need to track down the total liabilities figure. This is the flip side of the coin, representing all the company’s financial obligations to others. Just like with assets, liabilities are categorized based on when they’re due.
The two main buckets for liabilities are:
- Current Liabilities: These are debts that need to be paid off within one year. Common examples are accounts payable (money owed to suppliers), short-term loans, and accrued expenses like unpaid salaries.
- Long-Term Liabilities: These are obligations due more than a year out. This typically includes things like long-term bank loans, bonds the company has issued, and deferred tax liabilities.
Pro Tip: A classic mistake is to only grab the long-term debt for this calculation. You absolutely must use total liabilities—the sum of both current and long-term debts—for the ratio to mean anything. Confusing the two can dramatically skew your results and paint a completely wrong picture of the company’s financial footing.
By adding current and long-term liabilities, you get your total liabilities figure. This, too, is almost always presented as a clean subtotal on the balance sheet, usually right above the shareholder equity section. Once you’ve confidently pulled these two totals—total assets and total liabilities—you’re all set for the calculation itself.
Putting the Formula into Practice with Real Examples
Theory is one thing, but the real magic of the debt-to-asset ratio calculation happens when you apply it to actual businesses. The formula tells a story hidden in the numbers, but you can only read it when you see it in action. Let’s walk through two very different scenarios to see just how much context matters.
First, we’ll look at a small, service-based business to understand the ratio on a smaller scale. Then, we’ll shift gears to a capital-intensive manufacturing firm, which is a perfect example of how industry norms can completely change what a “good” ratio looks like.
This simple infographic gives a great visual of the calculation process.
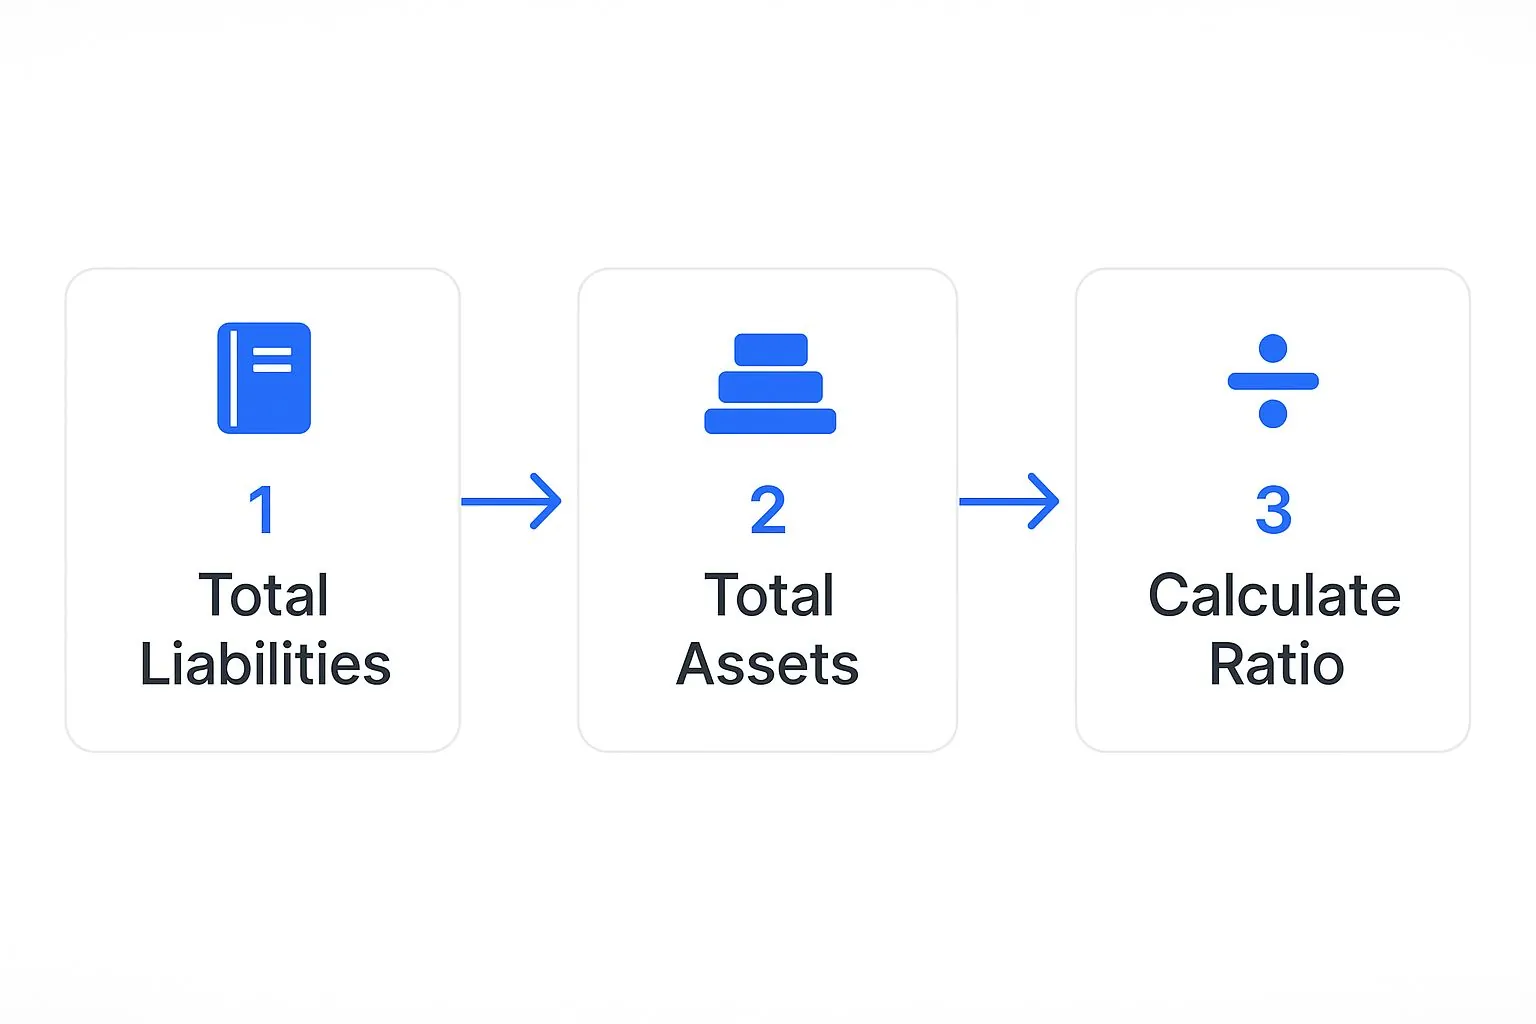
As you can see, it’s a straightforward flow: identify what you owe (liabilities), identify what you own (assets), and then do the division to get your ratio. Simple.
Example 1: A Small Service-Based Business
Let’s imagine a boutique marketing agency called “Innovate Digital.” As a service business, it doesn’t have a lot of physical assets. Its real value is in its team’s brainpower, not a warehouse full of equipment.
Here’s a simplified look at its books:
- Total Liabilities: $50,000 (This covers a small business loan, some credit card debt, and what it owes to freelance contractors.)
- Total Assets: $125,000 (This is a mix of cash in the bank, invoices clients still need to pay, and some office equipment.)
Now, let’s plug these numbers into our debt-to-asset ratio calculation:
$50,000 (Total Liabilities) / $125,000 (Total Assets) = 0.40
The result? 40% of Innovate Digital’s assets are financed through debt. For a small service company, this is generally a healthy and totally manageable level of leverage. It shows they’re using a bit of debt to fund operations and growth without getting in over their heads.
A ratio somewhere between 0.3 and 0.6 is often seen as a comfortable spot for many businesses, but this isn’t a hard-and-fast rule. At its core, any figure below 1.0 just means the company owns more than it owes—a fundamental sign of solvency.
Example 2: A Capital-Intensive Manufacturing Firm
Now, let’s pivot to “Precision Parts Inc.,” a company that makes automotive components. This kind of business is the polar opposite of our agency; it requires huge investments in factories, heavy machinery, and piles of raw materials.
Here’s a peek at its financials:
- Total Liabilities: $8,000,000 (This includes massive long-term loans for equipment, bonds sold to raise money, and other operational debts.)
- Total Assets: $12,000,000 (This is tied up in the factory itself, pricey machinery, a huge inventory of steel, and some cash reserves.)
Running the calculation for them looks like this:
$8,000,000 (Total Liabilities) / $12,000,000 (Total Assets) = 0.67
At first, a ratio of 0.67 (or 67%) might seem alarmingly high, especially next to our marketing agency. But in a capital-intensive world like manufacturing, this is often perfectly normal. Lenders know these companies need to take on significant debt to buy the assets that actually produce their products.
These two examples make it crystal clear: a “good” ratio isn’t a single magic number. It’s a range that depends entirely on the business model and the industry it operates in. The calculation itself is universal, but how you interpret the result is anything but.
How to Interpret What Your Ratio Is Telling You

Once you’ve run the numbers and have your debt-to-asset ratio calculation complete, you’re looking at a single figure. Whether it’s 0.25 or 0.75, that number is pretty meaningless on its own. The real magic is in the interpretation—understanding the story that number is telling you about a company’s financial health and strategic decisions.
At its core, the rule is simple: a ratio below 1.0 means a company owns more than it owes. This is the most basic sign of solvency. On the flip side, a ratio above 1.0 is a serious red flag, signaling that the company is in a precarious spot with more debt than assets.
But the analysis rarely stops there. A very low ratio, say under 0.4, usually points to a company on solid, conservative financial ground. It’s not leaning heavily on borrowed cash to get by, which speaks volumes about its stability. However, it could also mean the business is too cautious, possibly missing out on opportunities to use debt to fuel faster growth.
Decoding High and Low Ratios
A high ratio isn’t automatically a sign of impending disaster. It often means a company is using significant leverage—borrowing money to finance its assets. This can be an incredible engine for growth, especially if the returns generated by those assets far outpace the cost of the debt.
The catch, of course, is the risk. If business takes a downturn, those debt payments can quickly become a heavy burden.
A low ratio suggests a company that isn’t beholden to creditors. This provides a comfortable financial cushion, making it much more resilient during tough economic times. The trade-off? It might be growing at a slower, more deliberate pace than its more leveraged competitors. If you want to get a better handle on your own financial position, our guide on what net worth means and how to calculate it is a great place to start.
Key Insight: Think of the debt-to-asset ratio as a risk meter. A higher number dials up both the potential for amplified returns and the risk of financial distress. A lower number dials down both, paving the way for steadier, more predictable performance.
Industry Benchmarks Are Everything
Context is king when interpreting this ratio. One of the biggest mistakes you can make is not comparing a company’s ratio to its industry peers. What’s considered healthy for a utility company is completely different from what’s normal for a software firm. It’s an apples-to-oranges comparison that offers zero real insight.
For instance, capital-intensive sectors like utilities and manufacturing often carry higher debt loads because they need massive upfront investments in plants and equipment. It’s not uncommon to see their ratios climb above 60%. In stark contrast, a tech company with fewer physical assets might have a ratio under 30%. The global average for corporate debt-to-asset ratios typically hovers between 40%-50%, reflecting a common balance between growth and financial prudence.
To give you a clearer picture, here’s how different industries stack up.
Typical Debt to Asset Ratios by Industry
| Industry | Typical Ratio Range | Reasoning |
|---|---|---|
| Manufacturing | 0.5 – 0.7 | High investment in factories and machinery requires significant debt financing. |
| Technology/SaaS | 0.2 – 0.4 | Asset-light models with fewer physical goods mean less need for large-scale debt. |
| Utilities | 0.6 – 0.8 | Extremely capital-intensive with stable, predictable cash flows to service large debts. |
| Retail | 0.4 – 0.6 | Varies based on inventory and real estate holdings, but generally requires moderate leverage. |
This table shows why industry context is so vital. A manufacturing firm with a 0.65 ratio might be in a perfectly healthy position, but a software company with that same ratio could be seen as dangerously overleveraged.
The takeaway? Always ask: what’s the standard for this specific industry? That’s where the true meaning of the number lies.
Common Calculation Mistakes and How to Avoid Them

The accuracy of your debt-to-asset ratio is only as good as the numbers you plug in. One small oversight can completely warp the results, making a healthy company seem risky or a struggling one appear stable.
I’ve seen it happen time and again. Knowing the common pitfalls is your best defense against bad analysis.
One of the most frequent mistakes is grabbing the wrong liability figure. It’s so tempting to just glance at the “long-term debt” line on a balance sheet and run with it, but that gives you a dangerously incomplete picture.
You have to use total liabilities. This includes every single obligation, from short-term debts like accounts payable to long-term loans and bonds. Ignoring those current liabilities will always understate a company’s true financial commitments.
Overlooking Mismatched Financial Periods
Another subtle but critical mistake is mixing and matching figures from different timeframes. The numbers for your calculation absolutely must come from the same financial statement, representing the exact same point in time.
Pulling total assets from a Q4 report while using total liabilities from a Q2 report is a recipe for a useless metric. A business can change dramatically in just a few months, so your data has to be perfectly aligned for the ratio to mean anything.
It’s like trying to judge your personal budget by comparing last year’s salary to this month’s spending. The context is completely lost. Speaking of personal finances, it’s often helpful to see the full picture, and you can learn https://popadex.com/how-to-calculate-disposable-income/ to understand what’s really left after your own bills are paid.
Insider Tip: Always, always double-check the date at the top of the balance sheet. Make sure both your total assets and total liabilities are from the same reporting period, whether it’s a specific quarter-end or year-end statement.
Misinterpreting Shareholder Equity
Finally, some people get tripped up by shareholder equity, either confusing it with assets or trying to jam it into the formula. Remember, the formula is simple: Total Liabilities / Total Assets. Shareholder equity is what’s left for the owners after all debts are settled (Assets - Liabilities = Equity).
While it’s a vital part of the balance sheet, it has no direct role in this specific calculation.
Here’s a quick checklist I use to stay on track:
- Focus on the Right Numerator: Always use total liabilities, not just long-term debt.
- Verify the Denominator: Confirm you’re using the total assets figure.
- Sync Your Dates: Make sure both numbers come from the identical financial period.
- Ignore Equity (for this ratio): Keep shareholder equity out of the main calculation.
By sidestepping these common blunders, you can be confident that your debt-to-asset ratio is giving you a true and actionable insight into a company’s financial leverage.
Of course. Here is the rewritten section, crafted to sound like it was written by an experienced human expert, following all the provided guidelines and examples.
Common Questions About the Debt to Asset Ratio
Once you get the hang of calculating the debt-to-asset ratio, a few more nuanced questions usually pop up. It’s totally normal. Really understanding any financial metric means digging into the details and seeing how it works in the real world. Let’s tackle some of the most common ones I hear.
How High Is Too High?
This is the big one. Investors and business owners always want to know: at what point does a debt-to-asset ratio signal real danger? While every industry has its own “normal” range, a ratio that climbs past 1.0 is a universal red flag.
A ratio of 1.0 means a company’s debts are equal to its assets. Anything higher means it owes more than it owns. This is a precarious spot to be in, as the company is technically insolvent—it doesn’t have enough assets on the books to cover its liabilities if it had to pay them all off tomorrow.
What’s the Difference Between This and the Debt-to-Equity Ratio?
It’s easy to get these two leverage ratios mixed up. They both measure debt, but they tell you different things about a company’s financial health.
- Debt-to-Asset Ratio: This one shows you what percentage of a company’s assets are funded by debt. It’s all about leverage from an asset perspective.
- Debt-to-Equity Ratio: This ratio compares total debt to the money shareholders have invested. It looks at leverage from an ownership angle.
Think of it this way: the debt-to-asset ratio gives you a broad view of how reliant a company is on borrowing to exist. The debt-to-equity ratio tells you how much risk the company is taking on behalf of its owners.
Expert Insight: I always look at both ratios together. A huge gap between the two can be telling. It often means a company is aggressively using debt to boost returns for its shareholders, which cranks up both the potential rewards and the risks.
Can This Ratio Ever Be Negative?
It’s a rare and frankly scary scenario, but yes, a debt-to-asset ratio can be negative. For the math to work out that way, either total liabilities or total assets has to be a negative number.
Since you can’t owe less than nothing, negative liabilities are impossible. That means the only way to get a negative ratio is if a company has negative total assets. This happens when massive losses or huge write-downs of intangible assets completely wipe out the company’s entire asset base and then some. It’s a sign of extreme financial distress, far worse than just having a high ratio.
Getting a clear, confident view of your own financial picture starts with the right tools. PopaDex brings all your assets and liabilities into one place, so you can track your net worth and make smarter decisions without the guesswork. See for yourself and get started for free today.