Our Marketing Team at PopaDex
Free Net Worth Spreadsheet Template (2026)

A free net worth spreadsheet is your personal financial scoreboard. It’s a simple, powerful tool that lays out everything you own (your assets) and everything you owe (your liabilities) in one clean view. Think of it as a hands-on way to get clarity and control over your financial health, often going deeper than many automated apps can.
Why a Spreadsheet Is Your Financial North Star

Let’s be honest—most financial apps are black boxes. They spit out a single number but don’t always show you the why behind it. Building your own net worth spreadsheet is about taking back that control. It’s one of the most empowering steps you can take to boost your financial literacy.
This goes beyond passively watching numbers change. It’s about actively understanding the engine that drives your wealth. That hands-on approach gives you a level of insight that automated services just can’t replicate, showing you exactly how your assets and liabilities interact.
To get started, it’s crucial to understand the building blocks. Here’s a quick breakdown of what goes into a solid net worth spreadsheet.
Core Components of a Net Worth Spreadsheet
| Component | Definition | Examples |
|---|---|---|
| Assets | Anything you own that has monetary value. | Cash, checking/savings accounts, investments (stocks, crypto), real estate, vehicles. |
| Liabilities | Any debt or financial obligation you owe to others. | Mortgages, student loans, car loans, credit card debt, personal loans. |
| Net Worth Formula | The simple calculation that powers the entire sheet. | Total Assets - Total Liabilities = Your Net Worth |
This structure is the foundation. From here, you can customize it to fit your exact financial picture.
The Power of Manual Tracking
When you manually update your spreadsheet, you’re forced to do a monthly financial check-in. It’s a simple habit, but it connects you directly to your progress and makes your goals feel real. Abstract numbers on a screen suddenly transform into a clear story about your financial journey.
“There are a billion ways to track it, but I prefer using a plain ol’ Excel spreadsheet that I manually update at the end of every month. This forces me to stop and soak things in before moving on to the next shiny thing.”
This deliberate process builds accountability. You can’t just ignore a climbing credit card balance or gloss over a growing investment portfolio when you’re the one typing in the numbers. Every entry reinforces your financial reality, for better or worse.
Understanding Your True Financial Position
Knowing your net worth isn’t about bragging rights; it’s a vital sign of your financial health. It’s how you measure progress toward big goals like retirement, buying a home, or reaching financial independence. Without this baseline, you’re flying blind.
Just look at the financial landscape in America. Between 2019 and 2022, the average net worth was $1,063,700, but the median was only $192,900. That massive gap shows how a few ultra-wealthy individuals skew the average. The typical person’s situation is often completely different. Tracking your own number gives you personal context and shields you from misleading comparisons, letting you focus on what actually matters—your progress. You can dive deeper into these financial trends to see the bigger economic picture.
Key Benefits of a DIY Spreadsheet
Building your own free net worth spreadsheet has some serious advantages over just using a third-party app. You get complete ownership and a much deeper connection to your money.
Here’s what you gain:
- Total Customization: You decide exactly what to track and how. Want to add a category for your crypto portfolio, vintage watch collection, or future pension value? Go for it. The spreadsheet adapts to your life.
- Enhanced Financial Literacy: When you set up the categories and formulas yourself, you truly learn the mechanics of your finances. You’ll understand the difference between a liquid and an illiquid asset because you’re the one who has to classify them.
- Privacy and Security: Your most sensitive financial data stays with you, stored on your personal Google Drive or computer. You control who sees it, period. No need to worry about the data breaches that can affect third-party services.
- No Costs or Subscriptions: It’s called a free net worth spreadsheet for a reason. You skip the recurring fees that many financial apps charge, which means more money stays in your pocket to actually grow your net worth.
Building Your Spreadsheet in Google Sheets
You don’t need fancy, expensive software to get a handle on your finances. We’re going to start with a completely blank Google Sheet and turn it into a powerhouse financial tracker. The goal here is simple: build a clear, organized system that’s dead simple to read and even easier to update. Getting this initial setup right is the bedrock of your entire system.
We’ll build it from the ground up, starting with separate tabs for your Assets, Liabilities, and a main Summary dashboard. This separation is crucial—it keeps everything clean and stops the spreadsheet from turning into a chaotic mess. Think of it like setting up dedicated filing cabinets for different parts of your financial life.
Setting Up Your Core Tabs
First things first, let’s organize the digital workspace. Open a new Google Sheet. You’ll see a single tab at the bottom, probably called “Sheet1.”
Go ahead and rename that first tab to “Summary”. This is going to be your main dashboard, the place you’ll glance at to see the big picture: total assets, total liabilities, and the all-important net worth figure.
Now, let’s add two more tabs:
- Click the little ”+” icon in the bottom-left corner to add a new sheet.
- Double-click the new tab’s name and change it to “Assets”.
- Do it one more time, creating a final tab named “Liabilities”.
That’s it. You now have a clean, three-tab structure that logically separates what you own from what you owe, with a central hub to tie it all together. For a deeper look at different layouts, our complete guide on building a net worth tracker in Google Sheets covers a few other structures you could try.
Structuring the Assets Tab
Click over to your “Assets” tab. The idea here is to list out everything you own that has some monetary value. We’ll set up a simple table to keep things from getting messy.
I find these columns work best for just about everything:
- Category: This is for broad groupings like ‘Cash’, ‘Investments’, or ‘Real Estate’.
- Item: Get specific here. Think ‘Chase Checking’, ‘Vanguard VTSAX’, or ‘Primary Home’.
- Value: The current market value of that asset.
This simple three-column format is flexible enough to handle pretty much any asset you can throw at it. It keeps the information scannable and primed for the formulas we’ll be plugging in later.
Here’s a quick example of how you might start filling it out. It gives you a clean, itemized view of everything you own.
This layout immediately gives you a detailed breakdown of your holdings, making it easy to see where your wealth is concentrated.
Designing the Liabilities Tab
Alright, now hop over to the “Liabilities” tab. We’re going to set this up almost exactly like the Assets tab to keep things consistent and intuitive. You’re just listing out all your debts here.
Create a table with these columns:
- Category: Use groupings like ‘Mortgage’, ‘Student Loans’, or ‘Credit Card Debt’.
- Item: The specific name, such as ‘Home Mortgage’, ‘Federal Student Loan’, or ‘Chase Sapphire Card’.
- Balance: The current amount you owe.
Pro Tip: For revolving debt like credit cards, I find it’s often better to track the statement balance instead of the ever-changing current balance. It gives you a more stable monthly snapshot that lines up with your billing cycle. Pick whichever method feels more natural for you.
By mirroring the Assets tab structure, you’re building a system that just makes sense. Honestly, this foundational work is the most important part of creating a reliable free net worth spreadsheet.
With your assets and liabilities neatly cataloged on their own tabs, you’ve officially laid the data foundation. You’ve created the raw material. Next up is the fun part: using this organized information to bring your “Summary” tab to life, which is where the magic really happens. We’ll pull it all together to calculate your real-time net worth.
Automating Your Finances With Smart Formulas
Alright, you’ve got your assets and liabilities neatly organized. Now it’s time to make this spreadsheet work for you. A static list of numbers is fine, but a dynamic dashboard that updates itself? That’s the real goal.
We’re going to use a few smart formulas to handle the heavy lifting. This will turn your simple ledger into an intelligent financial tool that saves you a ton of time and, just as importantly, cuts down on the chance of typos and miscalculations. No more manually looking up stock prices or adding up categories by hand.
This infographic breaks down the simple flow we’ve been following to build our tracker from the ground up.
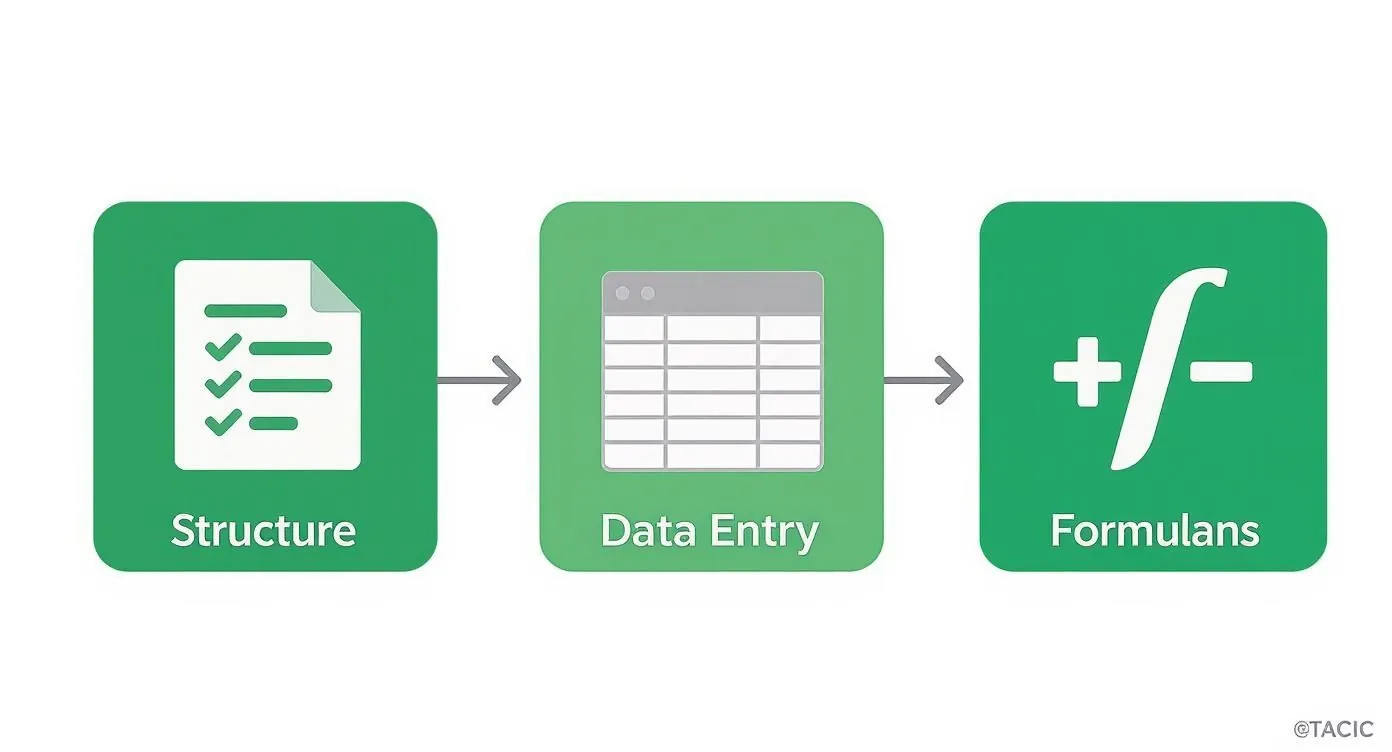
As you can see, a structured approach—starting with the sheet’s design, moving to data entry, and finishing with formulas—is what creates a solid, reliable financial dashboard.
Harnessing the Power of GOOGLEFINANCE
The real magic behind a truly automated free net worth spreadsheet in Google Sheets comes down to one function: GOOGLEFINANCE(). Honestly, this formula is the main reason I—and many others—prefer Google Sheets over Excel for personal finance tracking.
The GOOGLEFINANCE() function is a game-changer because it automatically pulls in financial data and refreshes it about every 20 minutes. This means you get a near-live look at your portfolio without lifting a finger. Excel, on the other hand, requires more manual setup to get the same result.
Let’s put it to work. Go to your “Assets” tab and add two new columns: ‘Ticker’ and ‘Shares/Units’.
- In the ‘Ticker’ column, you’ll enter the stock market symbol for your investment. Think “GOOGL” for Alphabet or “VTSAX” for a Vanguard index fund.
- In the ‘Shares/Units’ column, just pop in the quantity you own.
Now, in the ‘Value’ column for that same investment, you’ll replace the static number you had before with this simple formula:
=GOOGLEFINANCE(ticker_cell) * shares_cell
So, if “VTSAX” is in cell D5 and the number of shares you own is in cell E5, your formula would be =GOOGLEFINANCE(D5)*E5. That’s it. The sheet now pulls the latest price and calculates the total value for you.
Summarizing Totals With SUM and SUMIF
With your investments updating on their own, the next step is to pull all this information together on your “Summary” tab. We’ll start with the most basic yet essential function out there: SUM().
On your “Summary” tab, find a spot for ‘Total Assets’, ‘Total Liabilities’, and of course, ‘Net Worth’. To get your ‘Total Assets’, you’ll use a formula that adds up the entire ‘Value’ column from your “Assets” tab.
It looks like this: =SUM(Assets!C:C)
This tells Google Sheets to jump over to the “Assets” tab (that’s the Assets! part) and add up every number it finds in column C. You’ll do the exact same thing for your liabilities:
=SUM(Liabilities!C:C)
Your ‘Net Worth’ is then a simple subtraction right there on the “Summary” tab: = (cell for Total Assets) - (cell for Total Liabilities)
Ready for a slightly more advanced trick? What if you want to see a breakdown of your assets by category, right on your summary dashboard? This is where SUMIF() is incredibly useful. This function adds up numbers, but only if they meet a condition you set.
For example, to get a total for just your ‘Investment’ assets, you would use this:
=SUMIF(Assets!A:A, "Investments", Assets!C:C)
This formula scans column A in your “Assets” tab, finds every row you labeled “Investments,” and then adds up the matching values from column C. You can use this to create a clean, simple dashboard breaking down your holdings into Cash, Investments, and Real Estate.
Automating Beyond the Spreadsheet
These formulas can turn a basic spreadsheet into a pretty powerful financial engine. If you really want to get into the weeds and supercharge your tracking, learning how to automate Excel reports can teach you some invaluable techniques. While the guide is for Excel, the core principles of automation translate directly to what we’re building in Google Sheets.
But let’s be real—even the slickest spreadsheet has its limits. If you find that managing formulas and updating tabs is starting to feel like a chore, it might be time to look at dedicated tools. Our guide on how to automate your personal finances dives into platforms that handle all these calculations for you by connecting directly to your accounts.
A spreadsheet is a fantastic starting point, but knowing what comes next is the key to sticking with it for the long haul.
Visualizing Your Wealth and Progress

Numbers on a spreadsheet are just data. It’s the charts and graphs that bring your financial story to life. With all your raw data organized and the formulas humming along, it’s time to transform that “Summary” tab from a basic calculator into a powerful visual dashboard.
This is where you spot the trends, understand your financial makeup, and actually feel the impact of your progress. A quick glance at a chart can tell you more than scanning rows of numbers ever could. You can immediately see if your portfolio is too concentrated or if one particular debt is holding you back.
We’re going to build the three most powerful charts for any free net worth spreadsheet.
Creating Your Asset Allocation Pie Chart
First, let’s get a clear picture of your assets. A pie chart is the perfect tool for understanding your asset allocation—the mix of everything you own. It helps you instantly spot if you’re too heavy in one area, like having 90% of your wealth tied up in a single property, which is a risk you might want to manage.
To build this, you’ll need a small summary table on your “Summary” tab. This table will use the SUMIF function we talked about earlier to pull your category totals together.
- Build a small summary table: On your “Summary” tab, create two columns. In the first, list out your main asset categories (e.g., Cash, Investments, Real Estate).
- Calculate the totals: In the column next to it, use the
SUMIFformula for each category to grab the total value from your “Assets” tab. - Insert the chart: Highlight this new table and navigate to
Insert > Chart. Google Sheets is pretty smart and will probably suggest a pie chart, but if it doesn’t, just select it from the chart editor.
Just like that, you have a dynamic breakdown of your assets. When you add a new investment or sell a stock, this chart updates automatically, giving you a live look at your financial mix.
Your financial strength gives you the power to make changes, and a visual dashboard is the map that shows you where to direct that power. Understanding your allocation helps you decide whether to invest more aggressively or build up your cash reserves.
Building a Liability Breakdown Bar Chart
Visualizing what you own is important, but understanding what you owe is just as critical. While you could use another pie chart for your debts, I find a bar chart (or a stacked bar chart) works much better. It clearly shows the scale of each debt, making it painfully obvious which one is your biggest financial anchor.
The steps are almost identical to what we just did for the asset chart:
- Create another summary table: Pop a new table on your “Summary” tab listing your liability categories (e.g., Mortgage, Student Loans, Credit Card Debt).
- Use
SUMIFagain: Pull the total balance for each debt category from your “Liabilities” tab. - Insert the chart: Highlight the data, go to
Insert > Chart, and choose a bar chart to get a clean, comparative view of your debts.
This visual makes debt-repayment strategy a breeze. Seeing a huge, high-interest credit card balance looming over a smaller student loan helps you focus your energy where it will make the biggest difference.
Tracking Your Net Worth Over Time With a Line Chart
This is my favorite chart. It’s the one that shows your net worth growing month after month, and it’s incredibly motivating. This visual turns your entire financial journey into a single line moving up and to the right, serving as a powerful reminder of how far you’ve come. It’s a technique bloggers like Budgets Are Sexy have used for over a decade to stay on track.
To make this happen, you’ll need a new “History” tab in your spreadsheet. Once a month, you’ll jot down three key numbers: the date, your total assets, and your total liabilities.
- Create a “History” tab: Set up columns for
Date,Total Assets,Total Liabilities, andNet Worth. - Log your data monthly: On the first of every month, copy the totals from your “Summary” tab and paste them as values into your “History” tab.
- Calculate historical net worth: In the ‘Net Worth’ column, just subtract that month’s liabilities from its assets.
- Insert a line chart: Highlight the
DateandNet Worthcolumns, head toInsert > Chart, and select a line chart.
This chart becomes your financial North Star. During those months when the market tanks or you feel like you’re not making progress, a quick look at your long-term upward trend is all the motivation you’ll need to stay the course.
Choosing a Free Net Worth Template That Fits You

If building a spreadsheet from the ground up sounds like a chore, you’re not alone. Starting with a pre-built template is a fantastic way to get going, letting you focus on your numbers instead of wrestling with formulas and formatting.
But here’s the thing: not all templates are created equal. Some are beautifully simple, designed for beginners who just want to see their bottom line. Others are complex beasts built for the FIRE (Financial Independence, Retire Early) crowd, tracking every metric from savings rates to investment glide paths. The trick is to find one that matches your goals and your comfort level with spreadsheets.
Aligning the Template with Your Goals
Before you download the first flashy template you see, pause and think about what you actually need. Are you just starting out and need a clean, no-fuss dashboard? Or are you a seasoned investor who wants to slice and dice your asset allocation data?
- For Beginners: Look for templates with a single, clear dashboard. The goal is clarity, not complexity. You want to punch in your assets and liabilities without getting lost in a sea of tabs.
- For FIRE Followers: You’ll need more horsepower. Hunt for templates that include historical tracking, savings rate calculators, and charts that visualize your progress toward your “FI number.”
- For Visual Thinkers: Some templates are genuine works of art, with rich charts and color-coded dashboards that make your financial picture pop.
Choosing a template is like picking a workout plan. The “best” one isn’t the most complex—it’s the one you’ll actually stick with. An overly complicated free net worth spreadsheet will quickly become a chore, defeating the entire purpose.
The template scene has exploded, with great options now available for Google Sheets, Excel, and even Notion. You can find everything from Money Guy’s simple net worth tracker to more advanced versions from Spreadsheet Daddy. Many now include dedicated sections for tracking asset allocation, so you can see exactly what percentage of your portfolio is in stocks versus real estate.
Feel free to explore a wide variety of excellent free net worth spreadsheet templates to find one that clicks with you.
Comparison of Popular Free Net Worth Templates
To save you some legwork, here’s a quick breakdown of some of the most popular free templates out there right now. This table should help you figure out which one might be the right fit for your financial style and technical skills.
| Template Name | Best For | Key Features | Platform |
|---|---|---|---|
| The Money Guy Net Worth | Beginners & Simplicity | Clean, single-page dashboard; easy to update. | Excel |
| Squawkfox Net Worth | Minimalists | Bare-bones design, focused on essential numbers. | Google Sheets |
| Spreadsheet Daddy | Customizers & FIRE | Multiple versions with detailed charts and projections. | Google Sheets & Excel |
| Centsibly Living | Visual Planners | Aesthetically pleasing with excellent charts. | Google Sheets |
My advice? Don’t just pick one and run with it. Open a few, play around with the sample data, and see which one feels the most intuitive. The right template will feel less like a task and more like a tool that actually empowers your financial journey.
Common Questions About Net Worth Spreadsheets
Once you’ve got your spreadsheet up and running, a few practical questions always seem to pop up. Building the tracker is one thing; making it a sustainable habit is another. Let’s tackle the most common ones I hear.
How Often Should I Update My Spreadsheet?
The simple answer? As often as you’ll actually do it.
You’re looking for the sweet spot between obsessing over daily market swings and letting your data get so old it’s useless. For most people, a monthly update is the perfect rhythm.
Checking in once a month is frequent enough to spot any red flags—like an unexpected credit card balance—but not so often that it feels like a chore. It transforms the task into a manageable ritual. This cadence lets you see real progress without getting lost in the day-to-day noise of the market.
A monthly check-in is an intentional act. It’s your dedicated time to review progress, reconnect with your goals, and make sure you’re still on track.
How Do I Value Assets Without a Clear Price Tag?
Great question. Your investment accounts are easy—they have a real-time price. But what about your car, your house, or that collection of vintage comics? These are illiquid assets, and they require a bit of smart estimation.
Here’s how I handle them:
- Your Home: Grab a conservative estimate from a site like Zillow or Redfin. I always suggest using the lower end of their valuation range to avoid puffing up your net worth with an overly optimistic figure. You only need to update this once or twice a year.
- Your Car: Kelley Blue Book (KBB) is your go-to. Look up the “Private Party” value every six months or so. Cars are almost always depreciating assets, so expect this number to trend downwards.
- Collectibles: This is the trickiest bucket. Unless you’ve had something professionally appraised, it’s often best to use an extremely conservative estimate or just leave it off entirely. An asset is only worth what someone will actually pay for it, and that can be tough to pin down.
The goal here is consistency. Whatever method you pick, stick with it. That way, you’re always comparing apples to apples over time. For those weighing a DIY sheet against dedicated software, this comparison between Quicken and QuickBooks offers some good insights on how different platforms manage these asset types.
Keeping Your Financial Data Secure
Putting all your financial details in one place can feel a little exposed, so security has to be a top priority. The good news is that by using a platform like Google Sheets, you’re already behind Google’s heavy-duty security infrastructure.
Still, you need to do your part. Here are the non-negotiables:
- Use a Strong, Unique Password: This is security 101. Do not reuse a password from another service for the Google account that holds your financial data.
- Enable Two-Factor Authentication (2FA): This adds a crucial layer of defense. It requires a second step, like a code sent to your phone, before anyone can get in—even if they somehow steal your password.
- Avoid Public Wi-Fi: Never, ever update your spreadsheet on an unsecured network at a coffee shop, airport, or hotel.
Fixing Common Formula Errors
Nothing kills the mood faster than a bright red #N/A or #ERROR! popping up where your account balance should be. When your GOOGLEFINANCE() function breaks, it’s usually for a pretty simple reason.
Most of the time, the stock ticker is wrong or doesn’t exist anymore. Just double-check the ticker on Google Finance to make sure it’s correct. Occasionally, the function just can’t pull data for a specific fund, especially less common ones. If that happens, you’ll just have to update that asset’s value by hand. Don’t let a small formula bug derail you; it’s almost always an easy fix.
Managing a spreadsheet takes a bit of work, but the financial clarity it provides is more than worth it. Of course, if you find you’re spending more time wrestling with formulas than analyzing your progress, it might be time for an upgrade. PopaDex automates this whole process. It securely connects to your accounts, tracks everything in real-time, and visualizes your progress—no manual entry needed. See how it works at https://popadex.com.