Our Marketing Team at PopaDex
what is expense ratio: A Guide to Smarter Investing
When you invest in a mutual fund or an exchange-traded fund (ETF), you’re essentially hiring a team to manage your money. Just like any service, this comes with a fee. That fee is called the expense ratio.
Think of it as the annual management charge for your investment. It’s a small percentage automatically taken out of your investment each year to cover the fund’s operating costs, and it directly nibbles away at your total returns.
The Hidden Cost Draining Your Investments

Let’s use an analogy. Imagine you hired a professional chef to handle all your meals for the year. The cost for their salary, kitchen supplies, and other overhead is all bundled into a single annual fee. An expense ratio is the exact same concept for your investments—it’s the all-in cost for running the fund.
This small percentage might seem trivial at first glance, but don’t be fooled. The expense ratio is one of the most reliable clues to a fund’s future performance. Even a fraction of a percent can silently shave off tens of thousands of dollars from your portfolio over a few decades.
Getting a handle on what this number actually represents is your first step toward making smarter investment choices. If you’re just getting your feet wet, our guide on how to start investing money provides the perfect foundation.
Breaking Down the Components
So, what are you actually paying for with that single percentage? An expense ratio is typically a cocktail of three main costs:
- Management Fees: This is the biggest slice of the pie. It pays the salaries of the portfolio managers and analysts who research, pick, and monitor the fund’s investments.
- Operating Costs: These are the boring-but-necessary administrative expenses. Think record-keeping, legal fees, accounting, and customer service.
- 12b-1 Fees: Not all funds have this one. It’s a fee that covers marketing, advertising, and paying the brokers who sell the fund to investors.
The good news? These costs have been on a steady decline for years.
The expense ratio measures the annual operating costs of a fund as a percentage of its assets. Over the past two decades, there has been a dramatic decline in the average expense ratios paid by investors.
For instance, the average expense ratio for equity mutual funds plunged from 0.76% in 2000 down to just 0.26% for 401(k) plan participants by 2024. This trend makes building a low-cost portfolio easier than ever, but it also means there’s no excuse for overpaying. Understanding these hidden costs puts you firmly in control of your financial future.
Seeing How Fees Impact Your Bottom Line
It’s easy to dismiss a percentage point here or there. But when it comes to investing, those tiny numbers can feel distant and abstract until you see what they actually cost you in real dollars.
Understanding an expense ratio goes beyond learning a new piece of jargon; it’s about seeing its direct, real-world impact on your wallet. Let’s make this tangible with a quick, practical example.
Imagine you put $10,000 into a mutual fund. Buried in the fund’s documents, you see an expense ratio of 0.50%. That number seems small, almost insignificant. But it’s a real, recurring cost that chips away at your growth every single year.
Calculating the Real Cost
To see the annual fee, the math is refreshingly simple.
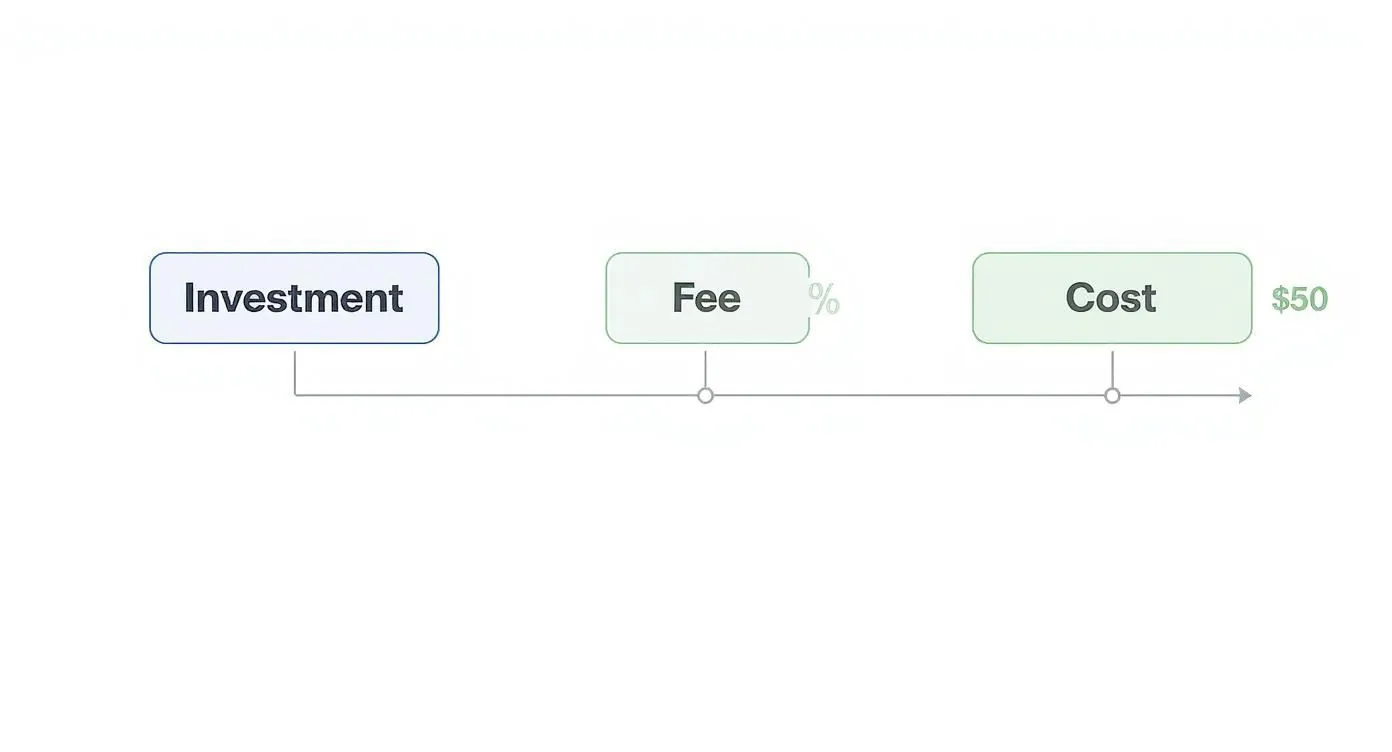
You just multiply your total investment by the expense ratio. Here’s how it looks:
- Total Investment: $10,000
- Expense Ratio: 0.50% (which is 0.005 as a decimal)
- Annual Fee Calculation: $10,000 x 0.005 = $50
That means $50 is quietly deducted from your investment returns each year to cover the fund’s operating costs. You won’t get a bill in the mail for it; it just happens behind the scenes, subtly reducing your portfolio’s growth.
This simple calculation is a powerful tool. Once you can quickly turn a percentage into a real dollar amount, you gain the ability to assess the true cost of any fund you’re considering. It’s no longer just a formula—it’s a new lens for evaluating every investment opportunity. This is how you shift from being a passive investor to an informed one who knows exactly where their money is going.
Seeing the tangible cost of an expense ratio transforms how you view your investments. What appears as a negligible percentage on paper becomes a significant, recurring fee that directly impacts your ability to build wealth over time.
This clarity is the foundation of smart investing. To truly understand and mitigate the long-term effects of fees on your portfolio, exploring various decision-making frameworks can provide a structured approach to evaluating investment options. Mastering this basic calculation gives you the confidence to compare funds and make choices that align with your financial goals, ensuring more of your money works for you.
How Small Fees Create a Major Drag on Your Growth
When you’re looking at a fund document, a small percentage like 1% might seem completely harmless. Trivial, even. But that seemingly tiny fee is one of the most destructive forces you’ll encounter in long-term investing. It creates a powerful effect called “fee drag,” which is like compounding in reverse—it quietly eats away at your wealth, year after year.
Over a short period, you’d barely notice the difference. But stretch that out over an investing lifetime of 20 or 30 years, and the gap between a low-cost and a high-cost fund can become a chasm. We’re talking about tens, or even hundreds, of thousands of dollars in lost growth. This goes beyond pinching pennies; it’s about protecting your future.
The Power of Compounding in Reverse
Let’s put this into perspective with two hypothetical investors. Both start with $10,000 and earn the exact same average annual return of 7% before fees over a 30-year period. The only thing that’s different is the expense ratio on their chosen fund.
- Investor A is savvy and picks a low-cost index fund with a tiny 0.10% expense ratio.
- Investor B goes with a more common actively managed fund charging a 1.00% expense ratio.
In the first year, the difference in fees is just $90. No big deal, right? But the real damage isn’t the $90 itself. It’s the lost opportunity for that money to grow and compound for the next 29 years. The fee doesn’t just vanish; it takes all of its potential future earnings with it.
This diagram breaks down how that fee gets calculated in a single year, which is the starting point for this long-term drag on your returns.
Every single year, that percentage-based fee is skimmed off the top, leaving you with a smaller principal to benefit from market growth the following year. It’s a slow leak that eventually drains your portfolio.
A 30-Year Growth Comparison of a $10,000 Investment
So, what happens when we fast forward three decades? This table illustrates the long-term impact of different expense ratios on portfolio growth, assuming a 7% annual return before fees. The results are pretty staggering.
| Metric | Fund A (0.10% Expense Ratio) | Fund B (1.00% Expense Ratio) | Difference |
|---|---|---|---|
| Final Portfolio Value | $72,669 | $57,435 | $15,234 |
| Total Fees Paid | $2,096 | $11,105 | $9,009 |
After 30 years, Investor B—the one with the higher fee—ends up with $15,234 less than Investor A. That seemingly insignificant 0.90% difference didn’t just cost them the fees themselves; it cost them all the growth that money could have generated over three decades.
This is a powerful illustration of why obsessing over expense ratios is one of the smartest things an investor can do.
The single best predictor of future fund performance is its cost. Lower fees mean you keep more of your money, allowing it to work for you through the power of compounding.
This principle is absolutely fundamental to successful investing. When you minimize fee drag, you maximize your potential returns. To see how returns are calculated and compound over time, you can dive deeper with our guide on the average rate of return.
Ultimately, hunting for the lowest possible expense ratios is one of the most impactful moves you can make for your long-term financial success.
Finding the Expense Ratio for Any Fund
Knowing how much high fees can cost you over the long run is one thing, but that knowledge is only useful if you can actually do something about it. To protect your portfolio, you’ll need to become a bit of a fee detective.
The good news? You don’t need a trench coat or a magnifying glass. Funds are legally required to disclose their fees, so the expense ratio is never really hidden. You just need to know where to look. Learning to spot this number quickly is a fundamental skill for any savvy investor.
Your Go-To Sources for Fee Information
Finding an expense ratio is surprisingly straightforward once you know the right places to check. Think of it as a simple scavenger hunt where the prize is keeping more of your own money.
Here are the most reliable spots to find what you’re looking for:
- The Fund Prospectus: This is the official, detailed legal document for any mutual fund or ETF. The expense ratio is always listed here, usually in a “Fees and Expenses” summary table right near the beginning. It’s the ultimate source of truth.
- Your Brokerage Website: Platforms like Vanguard, Fidelity, or Charles Schwab make this incredibly easy. When you look up a fund by its ticker symbol, the expense ratio is almost always displayed on the main summary page.
- Financial Data Websites: Independent platforms like Morningstar or Yahoo Finance are fantastic resources. They pull data for thousands of funds and present it in a clean, standardized format, which makes comparing fees a breeze.
Spotting the expense ratio goes beyond finding a number; it’s about building a habit. Consistently checking this metric before you invest is one of the simplest—and most effective—ways to protect your returns from being quietly eaten away.
This Morningstar screenshot, for example, shows a typical fund summary where the expense ratio is clearly displayed for easy access.
Notice how the fee is presented right alongside other key metrics. This lets you assess the fund’s cost at a quick glance, which is exactly what you want.
Bringing It All Together in Your Portfolio
Once you start identifying these fees, the next step is to see how they impact your portfolio as a whole. This is where diligent tracking comes into play. A solid investment tracking spreadsheet can help you log the expense ratio for each of your holdings.
By doing this, you get a bird’s-eye view of your total fee drag, turning what was once an invisible cost into a tangible number you can manage.
Making fee investigation a standard part of your process shifts you from being a passive investor to an empowered one. It’s a simple step, but it ensures more of your hard-earned money stays invested and working for you, not for the fund manager.
Why Some Funds Cost More Than Others
When you start digging into different investment funds, you’ll notice the fees are all over the map. One fund might charge a tiny 0.05% expense ratio, while another hits you with 1.00% or even more. What gives?
It almost always boils down to one thing: how the fund is managed.
You’ve basically got two camps: actively managed funds and passive index funds. Getting your head around the difference between these two is the secret to understanding why some funds cost a fortune and others are dirt cheap. Think of it as paying for a bespoke, hands-on service versus an efficient, automated one.
The Case for Active Management
Actively managed funds are the pricey ones, and there’s a reason for it. When you buy into one, you’re essentially hiring a team of expensive professionals—portfolio managers, analysts, economists—who are paid to try and beat the market.
Their job is to dive deep into research, predict economic shifts, and hand-pick the stocks or bonds they think will outperform everything else. This kind of work comes with some serious overhead:
- Salaries: Top-tier financial talent doesn’t come cheap.
- Research: These teams pay for premium data services and travel to get face-time with company executives.
- Trading Costs: All that buying and selling racks up brokerage commissions and other fees, which are ultimately passed on to you.
Because of this intense, hands-on style, active funds charge higher expense ratios. You’re paying for their expertise and the hope that they’ll deliver those market-beating returns.
The Simplicity of Passive Indexing
On the other end of the spectrum, you have passive index funds. Their mission is much simpler, and as a result, much cheaper. Instead of trying to beat the market, they aim to be the market.
An index fund’s game plan is straightforward: buy and hold all the stocks in a market index, like the S&P 500. There’s no star manager making genius stock picks or a squad of analysts searching for the next big thing. The whole operation is largely run by computer algorithms designed to perfectly mirror the index.
The core idea behind a passive fund is to slash costs to the bone. By cutting out the expensive research teams and constant trading, they can pass those huge savings right back to you.
This lean, no-frills approach leads to razor-thin expense ratios, often just a few hundredths of a percent.
This shift toward low-cost investing is a global trend. In 2025, the average mutual fund expense ratio worldwide hovered around 0.38%. Passive funds were typically charging less than 0.20%, while their active counterparts often cost more than 0.75%. You can discover more insights about global fund fees to see how this is playing out in different markets.
So, when it comes down to it, choosing between active and passive is about your own investment philosophy. Do you believe it’s worth paying more for a team’s shot at outperformance, or would you rather just capture the market’s return for the lowest possible cost? Understanding this difference is what lets you decide if a fund’s fee is a fair price to pay.
Looking Beyond the Standard Expense Ratio
While the expense ratio is a fantastic starting point for understanding a fund’s costs, it doesn’t always tell the whole story. If you want to analyze costs like a pro, you need to be aware of other expenses lurking just below the surface.
These costs aren’t included in the official expense ratio, but they can still take a bite out of your net returns. Think of the expense ratio as the sticker price on a car; it’s a critical number, but it doesn’t cover the full cost of ownership.
Digging Deeper with the Turnover Ratio
One of the most revealing metrics is the turnover ratio. This number, shown as a percentage, tells you how frequently a fund manager buys and sells assets within the portfolio over a year.
A fund with a 100% turnover ratio has effectively replaced its entire portfolio within that year. High turnover isn’t automatically bad, but it can create hidden costs that the expense ratio completely misses. These include:
- Trading Costs: Every time a fund buys or sells a security, it racks up brokerage commissions and other transaction fees. These costs come directly out of the fund’s returns, meaning less money for you.
- Tax Implications: Frequent selling can trigger capital gains. Those gains are often passed on to you as taxable distributions, creating an unexpected tax bill you have to pay.
A low turnover ratio, which you’ll often see in passive index funds, points to a more stable, buy-and-hold strategy that keeps these extra costs to a minimum.
The standard expense ratio gives you the fund’s operating costs, but the turnover ratio reveals the cost of its trading strategy. A high turnover can act as a second, hidden fee that quietly eats into your performance.
The Push for Greater Transparency
Thankfully, the investment world is slowly moving toward greater fee transparency, which has led to more inclusive metrics. A great example is the Total Global Expense Ratio (TGER), which has emerged as a standardized metric for measuring all fees and costs of real estate investment vehicles.
Since early 2021, the TGER has become a required metric for entities following certain global guidelines. This reflects a broader push to harmonize how expenses are reported. You can learn more about the TGER’s adoption and see how the industry is moving toward much-needed clarity.
By looking beyond the standard number, you get a much more complete picture of what you’re really paying to invest.
Your Expense Ratio Questions Answered
Once you start digging into investment fees, a few key questions always pop up. Getting straight answers is the first step toward feeling confident and making smarter calls with your money. Let’s walk through the most common ones.
What Is a Good Expense Ratio?
Figuring out what makes a “good” expense ratio really depends on the kind of fund you’re looking at. There isn’t a single magic number, but here are some solid benchmarks to keep in mind.
- Passive Index Funds (ETFs/Mutual Funds): For the funds that just track an index like the S&P 500, you should be looking for fees under 0.10%. Honestly, many of the big ones are even cheaper, hovering around 0.03% to 0.05%.
- Actively Managed Funds: These funds have actual managers and research teams trying to beat the market, so their costs are naturally higher. A competitive expense ratio for an active fund is generally below 0.75%, though you’ll see plenty under 1.00%.
Can Expense Ratios Change Over Time?
You bet they can. A fund’s board of directors has the power to raise or lower the expense ratio. The good news is that intense competition in the industry has been pushing fees down for years. Still, it’s a smart habit to check in on your holdings to make sure costs haven’t quietly crept up.
An expense ratio is not set in stone. While the trend has been downward, funds can and do adjust their fees, making it important to review your portfolio’s costs at least once a year.
Think of it as a quick financial health check-up. It ensures you aren’t paying more than you originally signed up for.
Ready to see all your investment fees in one place? PopaDex gives you a clear, consolidated view of your entire portfolio, helping you track costs and make informed decisions effortlessly. Get started with PopaDex today.