Our Marketing Team at PopaDex
Calculate Rental Income Like a Pro
Figuring out your rental property’s true profit goes way beyond just looking at the monthly rent check. At its core, the math is simple, but incredibly powerful: Gross Rental Income – Total Operating Expenses = Net Rental Income.
This is more than a formula; it’s the financial bedrock for understanding how your investment is really performing.
The Real Formula for Rental Property Profit
Let’s get right to it. The actual profit from your rental goes beyond the rent you collect minus your mortgage payment. There’s a much clearer formula that separates the numbers on the surface from the real-world returns you’re earning. Nailing this down is the first step toward making smart, informed decisions as a landlord.
Think of it as your financial roadmap. On one side, you have every dollar coming in. On the other, every dollar going out. What’s left in the middle is what truly matters.
Gross Income: The Full Picture
Your Gross Rental Income is the total amount of money your property brings in before a single expense is taken out. A lot of new landlords make the mistake of thinking this is just the monthly rent. It’s so much more. For an accurate calculation, you need to account for every single income source.
This usually includes things like:
- Monthly Rent: The main event, of course.
- Additional Fees: This could be for pets, dedicated parking spots, or even on-site storage units.
- Late Fees: The charges you collect when tenants don’t pay on time.
- Application Fees: The costs prospective tenants cover during the screening process.
- Utility Reimbursements: If tenants pay you back for utilities like water or trash services.
- Ancillary Income: Extra cash from things like coin-operated laundry or vending machines on the property.
Add all of these streams together, and you get your true Gross Rental Income. This is the starting point for any serious financial analysis of your property.
To give you a clearer overview, here are the core variables you’ll be working with.
Core Components of Rental Income Calculation
| Component | Description | Example | | :— | :— | :— | | Gross Rental Income | The total revenue generated by the property before any expenses are deducted. | $2,000 monthly rent + $50 pet fee + $25 parking fee | | Operating Expenses | All costs required to maintain and manage the property, excluding the mortgage principal and interest. | Property taxes, insurance, repairs, property management fees | | Net Rental Income | The final profit after subtracting all operating expenses from the gross rental income. | $2,075 (Gross Income) - $500 (Expenses) = $1,575 |
This table breaks down the essentials, but the real devil is in the details of your operating expenses.
A Preview of Operating Expenses
Operating expenses are all the ongoing costs needed to keep your property up and running—and this does not include your mortgage payment. These are the numbers that often catch new investors by surprise and can seriously eat into profits if you aren’t tracking them meticulously. To really get ahead, exploring different strategies to maximize rental income can make a huge difference in your bottom line.
A common rule of thumb lenders use is the 25% vacancy and maintenance factor. They often qualify you for a loan by calculating your rental income as just 75% of the gross monthly rent. It’s a conservative buffer that accounts for those inevitable empty months and unexpected repair bills.
These costs are the other half of our profit equation. They represent the day-to-day financial reality of owning property that goes far beyond the purchase price. For a more thorough look at getting your financial life in order, our guide on financial planning for beginners is a great place to start.
In the next sections, we’ll dive deep and break down every one of these expenses, helping you move from a basic grasp to a complete financial mastery of your investment.
Projecting Your Total Potential Income
Before you can subtract a single expense, you need a rock-solid idea of what your property can actually earn. This goes beyond plucking a rent price out of thin air. It’s about digging into the market and uncovering every possible income stream to accurately calculate rental income.
Smart investors know this is part art, part science. They use data to set a competitive rent, but they also have the experience to know that the real gross income often has a few extra layers.
Establishing Your Market Rent
Getting the rent right is the bedrock of your entire financial projection. If you price it too high, you’re staring down the barrel of costly vacancies that bleed cash. Price it too low, and you’re just leaving money on the table every single month.
A great place to start is with online tools like Zillow and Rentometer. They’ll give you a baseline by looking at what similar properties nearby are renting for. But that’s just the beginning. The real magic happens when you get granular and compare the features that tenants actually pay for:
- Location: Are you a five-minute walk to the train or a five-minute drive? It matters.
- Upgrades: Does your place have a sparkling new kitchen while the comp down the street has cabinets from the ’80s?
- Size and Layout: How does your square footage and bed/bath count compare?
- Amenities: In-unit laundry is a game-changer. So are things like a dishwasher, a private balcony, or even just good closet space.
These specifics are what allow you to confidently adjust your rent up or down from the market average. It’s how you stay competitive while maximizing what you bring in.
Of course, the bigger picture matters, too. National rent trends can give you context. For instance, while the US national median rent was $1,373 at the end of last year—a slight 0.6% dip year-over-year—it’s still a whopping $225 higher than it was just three years ago. This shows why you need to know your local market inside and out; you can discover more about rental market trends and see how wildly they can vary by region.
Beyond the Monthly Rent Check
One of the biggest mistakes new landlords make is thinking gross income is just 12 times the monthly rent. To get the full financial picture, you have to account for every single dollar the property generates. These extra income streams might seem small on their own, but they can add up to a serious boost for your bottom line.
Think about all the extras you could offer:
- Parking Fees: A dedicated spot, especially a covered one in a city, is easily worth a monthly fee.
- Storage Units: Got an extra shed or some unused space in the basement? Rent it out.
- Pet Fees: Whether it’s a one-time non-refundable fee or a monthly “pet rent,” this helps cover the extra wear and tear.
- Late Payment Fees: This incentivizes on-time payments, but when you do collect one, it’s income.
- Utility Reimbursements: If you bill back tenants for services like water or trash (often called a RUBS system), that money is part of your gross income.
It’s easy to see how a unit renting for $1,500 a month could pull in an extra $100-$150 from these add-ons. That’s over $1,200 in extra gross income per year. Not bad.
From Potential to Effective Gross Income
Once you’ve tallied up your rent and all your ancillary fees, you’ve found your Potential Gross Income (PGI). This is your “perfect world” number—the absolute maximum your property could earn with 100% occupancy and all fees collected on time.
But let’s be real. We don’t invest in a perfect world. The next, more practical step is to find your Effective Gross Income (EGI).
Effective Gross Income (EGI) is your Potential Gross Income (PGI) minus the money you lose from vacancy and tenants who don’t pay. This number is what you can realistically expect to collect.
Vacancy is simply a cost of doing business. Even the best properties have turnover. To account for this, seasoned investors apply a vacancy rate—usually somewhere between 5% and 10% of the PGI, depending on how hot the local rental market is.
Scenario: A Duplex Owner’s Calculation
Let’s walk through a real-world example. Say you own a duplex, and each unit rents for $2,000 per month.
- Calculate Potential Gross Income (PGI):
- Monthly Rent: $2,000/unit x 2 units = $4,000
- Annual PGI: $4,000 x 12 months = $48,000
- Apply a Vacancy Rate:
- Your local market is pretty strong, so you feel comfortable using a conservative 5% vacancy rate.
- Vacancy Loss: $48,000 (PGI) x 0.05 = $2,400
- Determine Effective Gross Income (EGI):
- EGI = PGI - Vacancy Loss
- EGI = $48,000 - $2,400 = $45,600
That $45,600 is your true top-line number. It’s the realistic starting point you’ll use before subtracting all your operating expenses, which is the next crucial step to uncovering your property’s real profitability.
Uncovering All Your Operating Expenses

This is where the pros separate themselves from the amateurs. Once you have a realistic handle on your Effective Gross Income, it’s time to face the other side of the ledger: the operating expenses that can quietly chew through your profits. To accurately calculate rental income, you have to be relentless in tracking every single cost.
Forgetting even one or two seemingly minor expenses can wreck your entire analysis, tricking you into believing a property is a goldmine when it’s really a dud. Let’s build a comprehensive expense sheet that leaves no stone unturned.
Fixed vs. Variable Costs: Know What to Expect
Not all expenses are created equal. I find it helpful to group them into two main buckets: fixed and variable. This simple categorization makes budgeting worlds easier and helps you anticipate your cash needs throughout the year.
Fixed expenses are your predictable, recurring costs. They show up like clockwork every month or year, forming the financial baseline for your property.
- Property Taxes: A non-negotiable bill from your local government.
- Insurance: This covers your landlord and hazard insurance policies.
- Mortgage Interest: Remember, only the interest portion is an operating expense, not the principal payment.
- HOA Fees: If you’re in a homeowners’ association, these are a regular fixed cost.
Variable expenses, on the other hand, are the ones that fluctuate. These are much harder to predict and are precisely why you need a healthy cash buffer. This is the category that trips up most new landlords.
A common rule of thumb you’ll hear is the “50% Rule,” which suggests half your gross rent will go to operating expenses (not counting the mortgage). It’s a decent back-of-the-napkin check, but it’s a poor substitute for tracking your actual, specific costs. Relying on it blindly is a recipe for some nasty financial surprises.
The Hidden Costs That Wreck Your Profits
Beyond the obvious bills, a whole host of smaller, often-forgotten costs can add up fast. Successful investors account for everything, ensuring their net income calculation is as close to reality as possible. Don’t let these slip through the cracks.
Below is a checklist of common operating expenses you absolutely must track. Think of it as your financial safety net.
| Expense Category | Specific Items | Typical Frequency |
|---|---|---|
| Property & Management | Property Management Fees, HOA Fees, Advertising/Marketing, Tenant Screening | Monthly / As Needed |
| Maintenance & Repairs | Plumbing, Electrical, HVAC Service, Appliance Repair/Replacement, Painting, General Labor | As Needed |
| Taxes & Insurance | Property Taxes, Landlord Insurance, Liability Insurance | Annually / Semi-Annually |
| Utilities | Water, Sewer, Trash, Electricity (Common Areas), Gas | Monthly |
| Professional Services | Legal Fees (Leases, Evictions), Accounting/Bookkeeping, Tax Preparation | As Needed / Annually |
| Grounds & Exterior | Landscaping/Lawn Care, Snow Removal, Pest Control | Monthly / Seasonally |
Keeping a detailed list like this ensures you’re building a true picture of your property’s performance, not just a fantasy.
Tallying Up the Expenses for Our Duplex
Let’s get back to our duplex example. We already figured out its Effective Gross Income (EGI) is $45,600 per year, which breaks down to $3,800 per month. Now, let’s build out a detailed monthly expense sheet to see where that money really goes.
- Property Taxes: $400
- Insurance: $150
- Repairs & Maintenance (10% of EGI): $380
- Property Management (10% of EGI): $380
- Landscaping: $100
- Pest Control: $50
- Utilities (Water/Sewer): $120
Adding it all up, our Total Monthly Operating Expenses come to $1,580.
Notice how we’ve set aside a percentage for repairs and property management. This is a crucial habit for budgeting against variable costs, even if you don’t spend that exact amount every single month. Beyond these immediate outlays, it’s vital to think long-term by planning for future expenses with reserve funds—an often-overlooked but critical operating cost for things like a new roof or HVAC system.
Now that we have our income and expenses clearly defined, we’re ready to put it all together and find the real net income and cash flow.
Calculating Your Net Income and Cash Flow
This is the moment of truth. After you’ve carefully projected your income and detailed every last expense, it’s time to put all the pieces together. This is where you move past the spreadsheets and hypotheticals to find the two numbers that truly define an investment’s success: Net Operating Income and, most importantly, your actual cash flow.
Right now, we’ll turn your lists of numbers into a clear verdict on your property’s financial health. It’s the final, crucial step to see what’s really left in your pocket at the end of the day.
This simple guide breaks down the core process of getting from your total potential revenue all the way down to your net income.
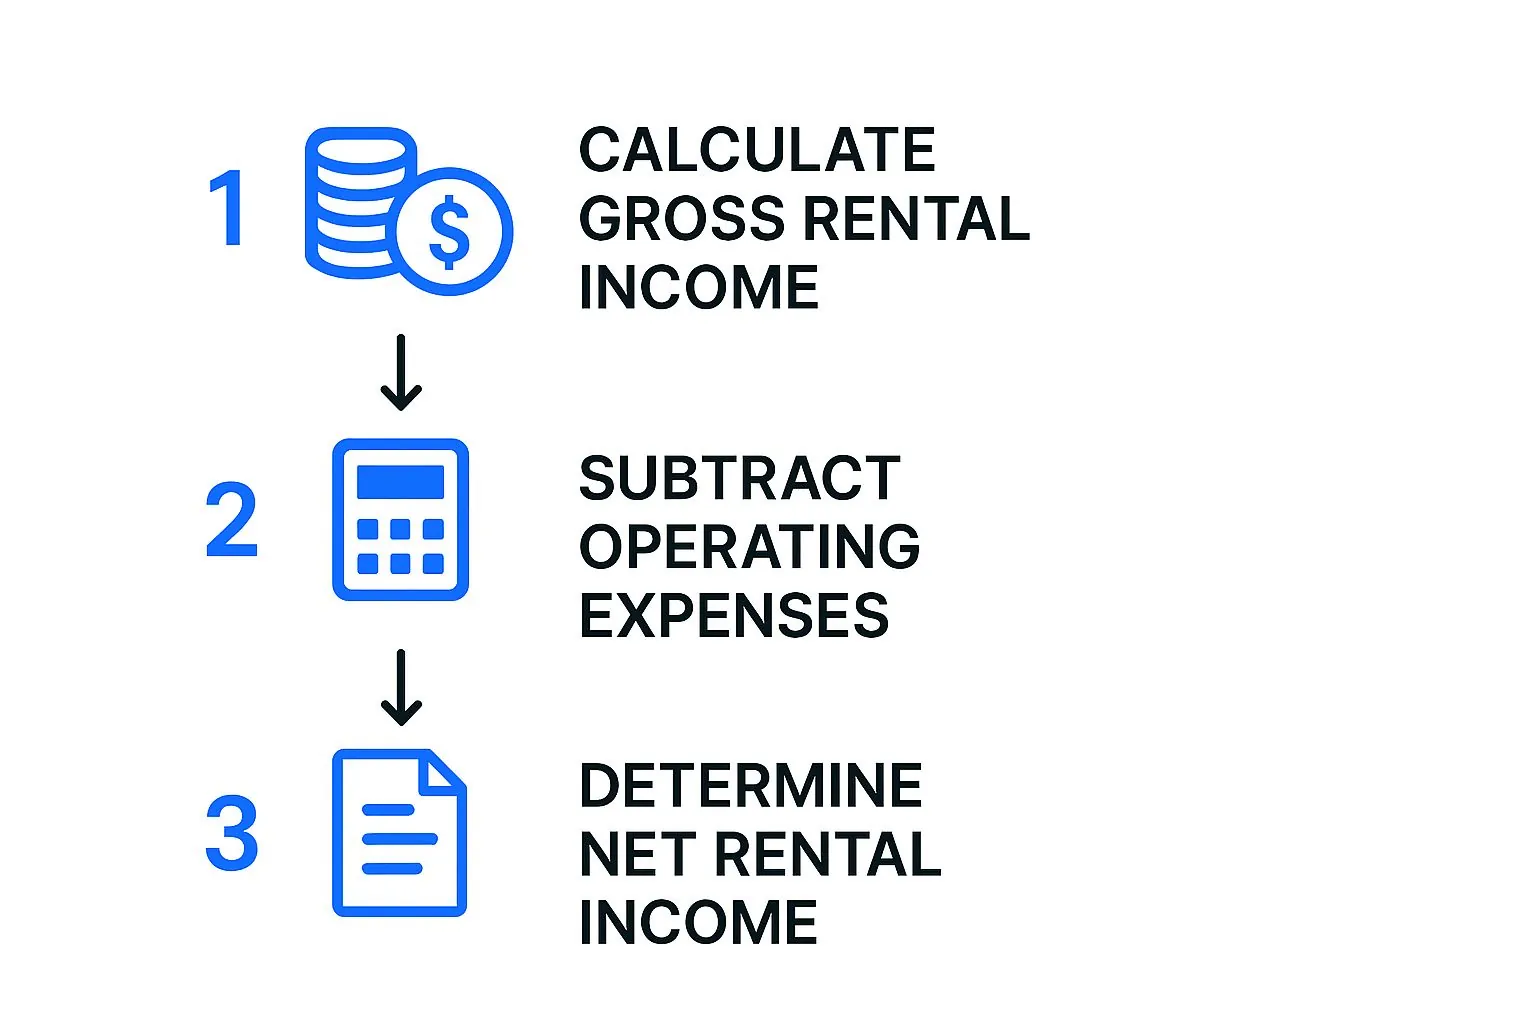
As the visual shows, it’s a straightforward path: start with all your income, subtract all your operational costs, and you’ll land on your net figure.
Finding Your Net Operating Income (NOI)
First up, let’s nail down your Net Operating Income (NOI). This is a gold-standard metric in real estate for a good reason. It shows you exactly how profitable a property is before you factor in any financing or mortgage payments. This gives you a clean, apples-to-apples way to compare different properties, no matter how they were purchased.
The formula couldn’t be simpler:
Effective Gross Income (EGI) – Total Operating Expenses = Net Operating Income (NOI)
Let’s go back to our duplex example. We already established a realistic Effective Gross Income (EGI) of $45,600 per year. We also tallied up our annual operating expenses to $18,960 ($1,580/month x 12).
Here’s the math: $45,600 (EGI) - $18,960 (Expenses) = $26,640 (NOI)
That $26,640 is the annual profit the duplex generates from its own operations. It’s a powerful number, but it’s not the cash you can go spend just yet. We still have one more major expense to account for.
The Final Step to True Cash Flow
Now we get to the number every investor really cares about: cash flow. This is the money left over after all the bills are paid, and that includes the mortgage. It’s the profit that actually hits your bank account each month—the lifeblood of any sustainable rental portfolio.
To find your cash flow, you just subtract your annual mortgage payments (the principal and interest) from your NOI.
Net Operating Income (NOI) – Total Annual Mortgage Payments = Annual Cash Flow
Let’s say the total mortgage payment for our duplex—what lenders often call PITIA (Principal, Interest, Taxes, Insurance, Association fees)—is $2,000 per month. But wait. We already deducted taxes and insurance as operating expenses, so to avoid double-counting, we only need to subtract the principal and interest portion here. Let’s assume that comes out to $1,600 per month.
- Annual Debt Service: $1,600 x 12 months = $19,200
Now for the final calculation: $26,640 (NOI) - $19,200 (Debt Service) = $7,440 (Annual Cash Flow)
That breaks down to $620 in positive cash flow every single month. That’s $7,440 a year you can use to build up reserves, save for another property, or put toward other financial goals. It’s powerful to see how this new income stream fits into your bigger financial picture. You can even use tools like a retirement nest egg calculator to visualize its long-term impact.
Key Insight: Positive cash flow is your ultimate safety net. It’s the buffer that protects you from surprise vacancies and big-ticket repairs without forcing you to dip into your personal savings. A property with negative cash flow isn’t an asset; it’s a liability.
The Verdict on Our Duplex
So, is our duplex a winner? With $620 in positive monthly cash flow, the answer is a resounding yes. The property not only pays for itself but also generates a healthy profit.
This detailed process—from projecting realistic income to uncovering every expense and finally calculating NOI and cash flow—is the only way to invest with confidence. It removes the guesswork and emotion from the equation and replaces them with cold, hard facts. Follow these steps, and you’ll be able to accurately assess any potential deal and build a rental portfolio that generates reliable, long-term wealth.
Using Pro Tools and Metrics to Analyze Deals
 Once you’ve got a handle on the fundamentals of net income and cash flow, you’re ready to start thinking like a seasoned investor. Pros move beyond simple profit and loss, using specific metrics to expose the real potential of a deal.
These key performance indicators (KPIs) are the secret sauce. They let you compare completely different properties on an even playing field and see exactly what kind of return you can expect. This is the knowledge that turns you from just a landlord into a savvy investor who asks, “How efficiently will this property make me money compared to my other options?”
Capitalization Rate (Cap Rate)
One of the most powerful metrics in any investor’s toolkit is the Capitalization Rate, or Cap Rate. Think of it as a way to measure a property’s pure, unleveraged earning power. It completely ignores financing, giving you a clean look at the asset’s performance on its own.
The formula is refreshingly simple:
Cap Rate = Net Operating Income (NOI) / Property Purchase Price
Let’s go back to our duplex example. It had an NOI of $26,640. If you bought the property for $400,000, the math looks like this:
$26,640 / $400,000 = 0.0666, or a 6.7% Cap Rate
That 6.7% figure is gold. It allows you to quickly compare the duplex to a small commercial building or another rental across town, regardless of how you plan to pay for them. Generally, a higher cap rate suggests a higher potential return, but it often comes with more perceived risk.
Cash-on-Cash Return (CoCR)
While the Cap Rate tells you about the property’s performance, the Cash-on-Cash Return (CoCR) tells you about your performance. It answers a very personal question: how hard is my invested cash actually working for me? This metric is critical because it factors in your financing, showing the direct return on your down payment and closing costs.
Here’s the formula:
CoCR = Annual Cash Flow / Total Cash Invested
Sticking with our duplex, we had an annual cash flow of $7,440. Let’s say your total cash out-of-pocket for the down payment, closing costs, and a few initial repairs was $85,000. The CoCR would be:
$7,440 / $85,000 = 0.0875, or an 8.8% Cash-on-Cash Return
This means for every dollar you personally put into the deal, you’re getting back almost nine cents in profit each year. That’s a powerful number to know.
Investor Insight: Cap Rate is for comparing properties; Cash-on-Cash Return is for evaluating your specific deal. A great property (high Cap Rate) can become a bad deal if your financing terms are poor, resulting in a low CoCR. Conversely, favorable financing can make a modest property an excellent personal investment.
Choosing the Right Tools
Let’s be honest, running these numbers by hand for every potential deal gets old fast. Luckily, you don’t have to. Many investors start with custom spreadsheets, which offer amazing flexibility. As you start analyzing more properties, dedicated rental property calculators can be a massive time-saver.
Of course, these tools are only as good as the data you give them. The foundation of any smart investment is a rock-solid understanding of your own finances. To that end, you might find our guide on how to budget money effectively helpful. It can give you a crystal-clear picture of what you can actually afford to invest.
When you combine strong personal budgeting with these professional real estate metrics, you’re positioned to make smarter, more confident investment decisions every single time.
Of course. Here is the rewritten section, crafted to sound completely human-written and match the provided style examples.
Common Questions About Rental Income
Once you’ve got the basic formulas down, the real-world questions start popping up. Running the numbers on an actual property is never as clean as a spreadsheet, so let’s dig into the common curveballs you’ll face when you calculate rental income.
Getting these details right is what separates a good investment from a great one.
Net Income vs. Taxable Income
Here’s a distinction that trips up a lot of new investors: your net rental income (the cash you actually pocket) and your taxable rental income are two very different figures. They both start with gross income minus operating expenses, but the IRS gives landlords a powerful tool called depreciation.
Depreciation is a “paper expense” that lets you deduct the gradual wear and tear on your property over time. You haven’t actually spent this money, but you can still deduct it on your tax return. The result? Your taxable income is often much lower than your true net operating income, which is a huge win.
How Do You Plan for a New Roof?
What happens when you get a $10,000 bill for a new roof or the HVAC unit finally gives out? You can’t just hope for the best. This is where a dedicated capital expenditure (CapEx) reserve fund comes in. Smart investors don’t see this as optional; they treat it as a fixed monthly expense, even if the money just sits in an account.
A solid rule of thumb is to sock away 5% to 10% of your gross monthly rent specifically for these big-ticket repairs down the road.
Think of it this way: by setting aside a piece of every rent check for CapEx, you turn a future crisis into a predictable business expense. It’s the difference between a major repair wiping out your cash flow for a year and just another line item you were prepared for.
This disciplined saving is what keeps your investment resilient.
What’s a “Good” Cash Flow, Anyway?
This is the million-dollar question, and the only honest answer is: it completely depends on your market and your strategy. An investor in a hot, high-appreciation market like Austin might be thrilled to break even on cash flow, banking on the property’s value skyrocketing over time.
On the other hand, an investor in a stable, cash-flow-focused market like Cleveland might be aiming for $300-$500 per door every month. There’s no magic number. Your “good” cash flow target has to line up with your personal goals—are you playing the long game for appreciation, or do you need that monthly income now?
Ready to see how your rental properties fit into your complete financial picture? PopaDex brings all your assets together, giving you a single, clear view of your portfolio. Track your net worth in real-time and see how your rental income powers your financial journey.