Our Marketing Team at PopaDex
Mastering Currency Exchange Rate Tracking
Tracking currency exchange rates is simply the process of watching how the value of one currency shifts against another. For anyone who deals with money across borders—whether for business, travel, or investments—it’s an essential practice for managing risk, spotting opportunities, and making smart financial moves.
Why You Should Actually Care About Exchange Rates
Before we get into the “how,” let’s talk about the “why.” It’s easy to dismiss minor currency fluctuations as just market noise, but those small shifts can have a massive, real-world impact on your bottom line. They can quietly shrink your profits, drive up travel costs, or even open up unexpected investment opportunities. The core reason for tracking them consistently is to get a handle on that volatility.
The foreign exchange (forex) market is the largest financial market in the world, with daily trading volumes hitting around $5 trillion. That massive scale means exchange rates are a real-time reflection of global supply and demand.
To get a better handle on these powerful market forces, TradingEconomics.com is a great resource for insights into world currencies.
Who Needs to Track Currencies and Why?
Currency tracking goes beyond Wall Street traders. Different people have different stakes in the game, and the impact can be surprisingly personal.
- E-commerce Owners: Imagine you run an online store in the US and buy inventory from a supplier in Japan. You have to keep a close eye on the USD/JPY rate. A sudden drop in the dollar’s value could spike your cost of goods overnight, squeezing your profit margins.
- International Travelers: If you’re planning a trip to Europe, you’ll want to monitor the USD/EUR pair. Exchanging your dollars when the euro is weaker means your travel budget stretches further. We’re talking an extra fancy dinner out or a better hotel room, just from timing it right.
- Freelancers and Expats: Think about a remote worker living in Spain but getting paid in British Pounds (GBP). They need to track the GBP/EUR rate closely. Converting their income at a favorable moment can seriously maximize their take-home pay. This is a huge part of effective multi-currency accounting.
- Investors: Someone holding assets in different countries uses exchange rates to see how their portfolio is really doing. A great return on a foreign stock can be completely wiped out by an unfavorable currency swing when it’s time to convert that money back home.
The infographic below shows how even a tiny 1% fluctuation can make a real financial difference for these individuals.
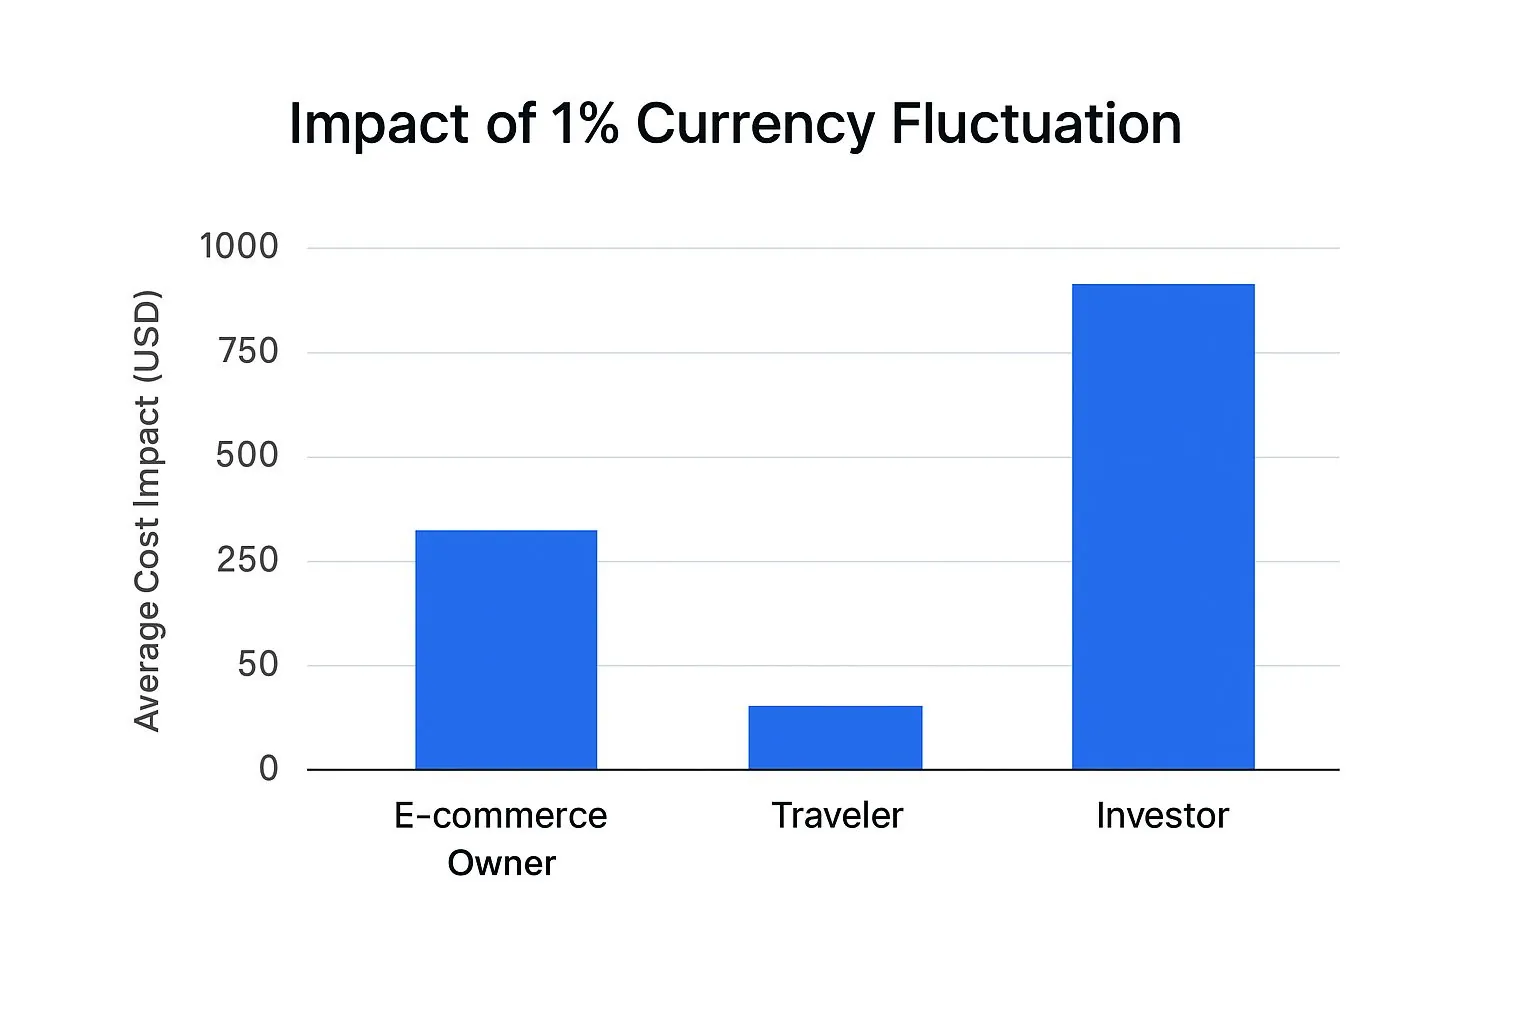
As you can see, what looks like a small percentage change can easily translate into hundreds or even thousands of dollars in gains or losses, depending on how much money is involved. To really get the full picture, it helps to spend some time understanding the forex industry itself.
At the end of the day, it’s simple: you’re not just watching numbers on a screen; you’re protecting your purchasing power. Good tracking helps you pinpoint the best time to buy, sell, or convert, turning market volatility from a threat into a strategic advantage.
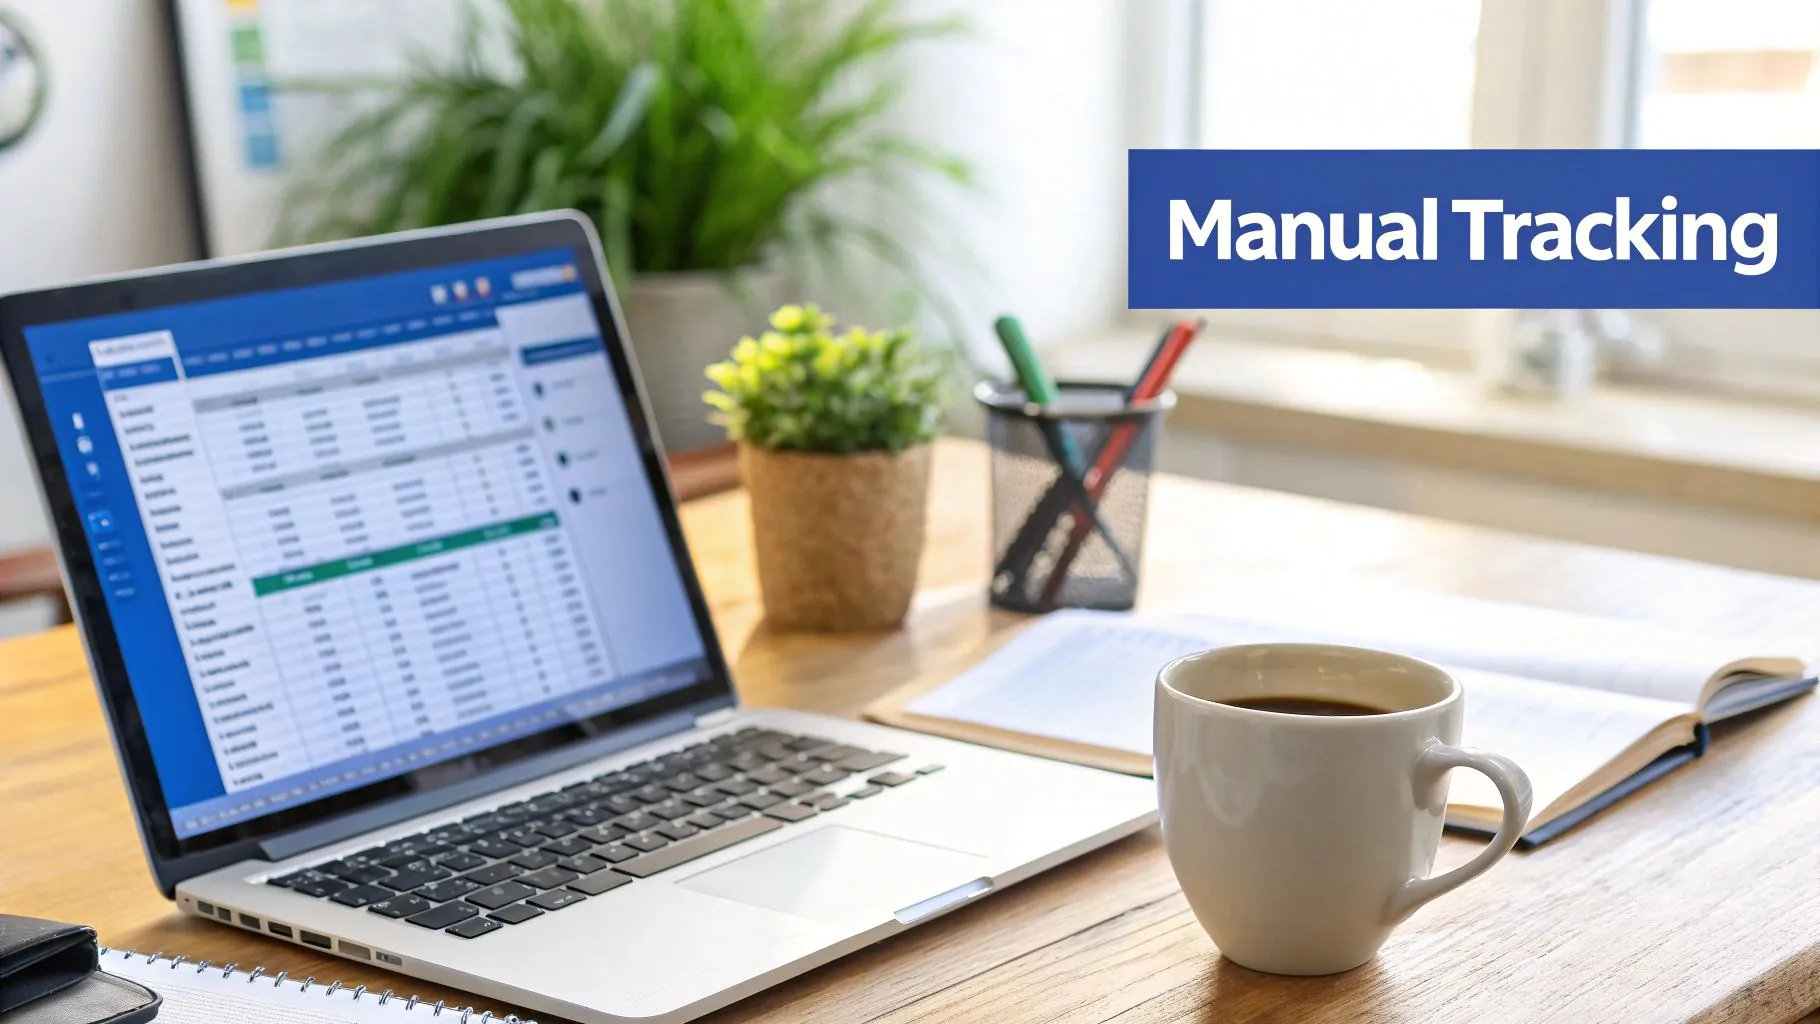
The Hands-On Approach to Manual Tracking
For some, a full-blown software solution is overkill. If you prefer a more direct, low-cost method or just have straightforward needs, manually tracking exchange rates can be incredibly effective. A well-designed spreadsheet puts you in the driver’s seat, letting you turn raw data into actionable insights with just a few simple formulas.
This isn’t about downloading a generic template. It’s about building a personalized tool that solves a specific problem. Let’s say you’re a freelance designer who just finished a project for a client in the UK. Your goal is to keep an eye on the GBP/USD exchange rate so you know the best time to send your invoice and convert your payment. Getting this right can mean a real difference in your earnings.
Sourcing Reliable Data
The whole system falls apart without accurate, trustworthy data. A quick online search might give you misleading retail rates that have markups baked in. You need to go straight to the source—authoritative places that provide historical and current data without the extra noise.
- Central Banks: Institutions like the US Federal Reserve provide detailed historical exchange rate data, often in what are known as H.10 releases. This is the kind of benchmark data that analysts around the world rely on.
- Financial Portals: Reputable financial news sites and portals usually have dedicated sections for currency markets, offering both live rates and historical charts.
Global central banks are the gold standard here. They publish official foreign exchange rates that set the baseline for the entire market. The Fed’s data, for instance, lets you track how currency valuations change on a monthly and even daily basis.
Designing Your Tracking Sheet
Once you’ve picked your data source, it’s time to set up your spreadsheet. A smart layout is what makes this whole process efficient instead of a chore. Here’s a simple structure that works well:
- Date Column: This is for recording the date of each entry. Whether you update daily or weekly, just be consistent.
- Exchange Rate Column: This is where you’ll manually plug in the rate you sourced for that day (e.g., GBP/USD).
- Target Rate Column: Define your ideal exchange rate. For our freelancer, this might be 1.2800.
- Percentage Change Column: A simple formula like
=(CurrentRate - PreviousRate) / PreviousRatewill automatically calculate the daily fluctuation. This gives you an instant read on the direction and size of the change.
Pro Tip: Use conditional formatting to create simple visual cues. For example, you can set a rule to turn the exchange rate cell green when it’s above your target rate and red when it drops below a certain point. It turns your simple sheet into a lightweight warning system.
With this kind of setup, you’re not just logging numbers—you’re building a story. You can easily add a basic line chart to visualize trends over time, which helps you spot patterns and decide the best moment to make your move. This hands-on method delivers a surprisingly functional and insightful system without the cost or complexity of specialized software.
Automating Your Tracking with PopaDex Tools
While a manual spreadsheet gives you a sense of control, it quickly becomes a bottleneck. If you’re managing multiple currency pairs or need to react to the market right now, constantly finding and plugging in data is a massive time-drain—not to mention a recipe for errors. This is where automation stops being a luxury and becomes essential for smart currency exchange rate tracking.
PopaDex is built to take that weight off your shoulders. It’s designed to shift you from just watching the numbers to making active, data-backed decisions. Setting up your first tracker is simple and pulls you out of the world of static spreadsheets into a live, dynamic monitoring environment.
But the real game-changer? Custom alerts. This is where the system truly starts working for you, 24/7.
From Passive Watching to Proactive Decisions
Picture this: you’re a corporate treasurer, and a big chunk of your company’s revenue comes from sales in Europe. That means you’re constantly converting euros (EUR) back to US dollars (USD). A sudden dive in the EUR/USD rate could wipe out a serious amount of profit.
Instead of nervously refreshing rate pages all day, you can set up targeted alerts in PopaDex to flag important movements instantly.
- Specific Rate Alerts: Get a ping the second the EUR/USD rate dips below a critical level, say 1.0500. This alert becomes your trigger to execute a hedge or maybe hold off on a conversion.
- Percentage Movement Alerts: You could also set an alert for when a currency pair moves by a certain percentage, like a 1.5% drop within 24 hours. This is great for catching major market shifts that could signal wider volatility.
- Volatility Spike Alerts: Get notified when there’s unusual market chatter. An unexpected spike in volatility can create both risks and opportunities, and an early heads-up lets you react before things calm down.
These alerts completely change your strategy. You’re no longer just a spectator; you’re building a strategic defense system for your finances. For anyone juggling complex international accounts, you can dive deeper by checking out our guide on getting started with multi-currency features.
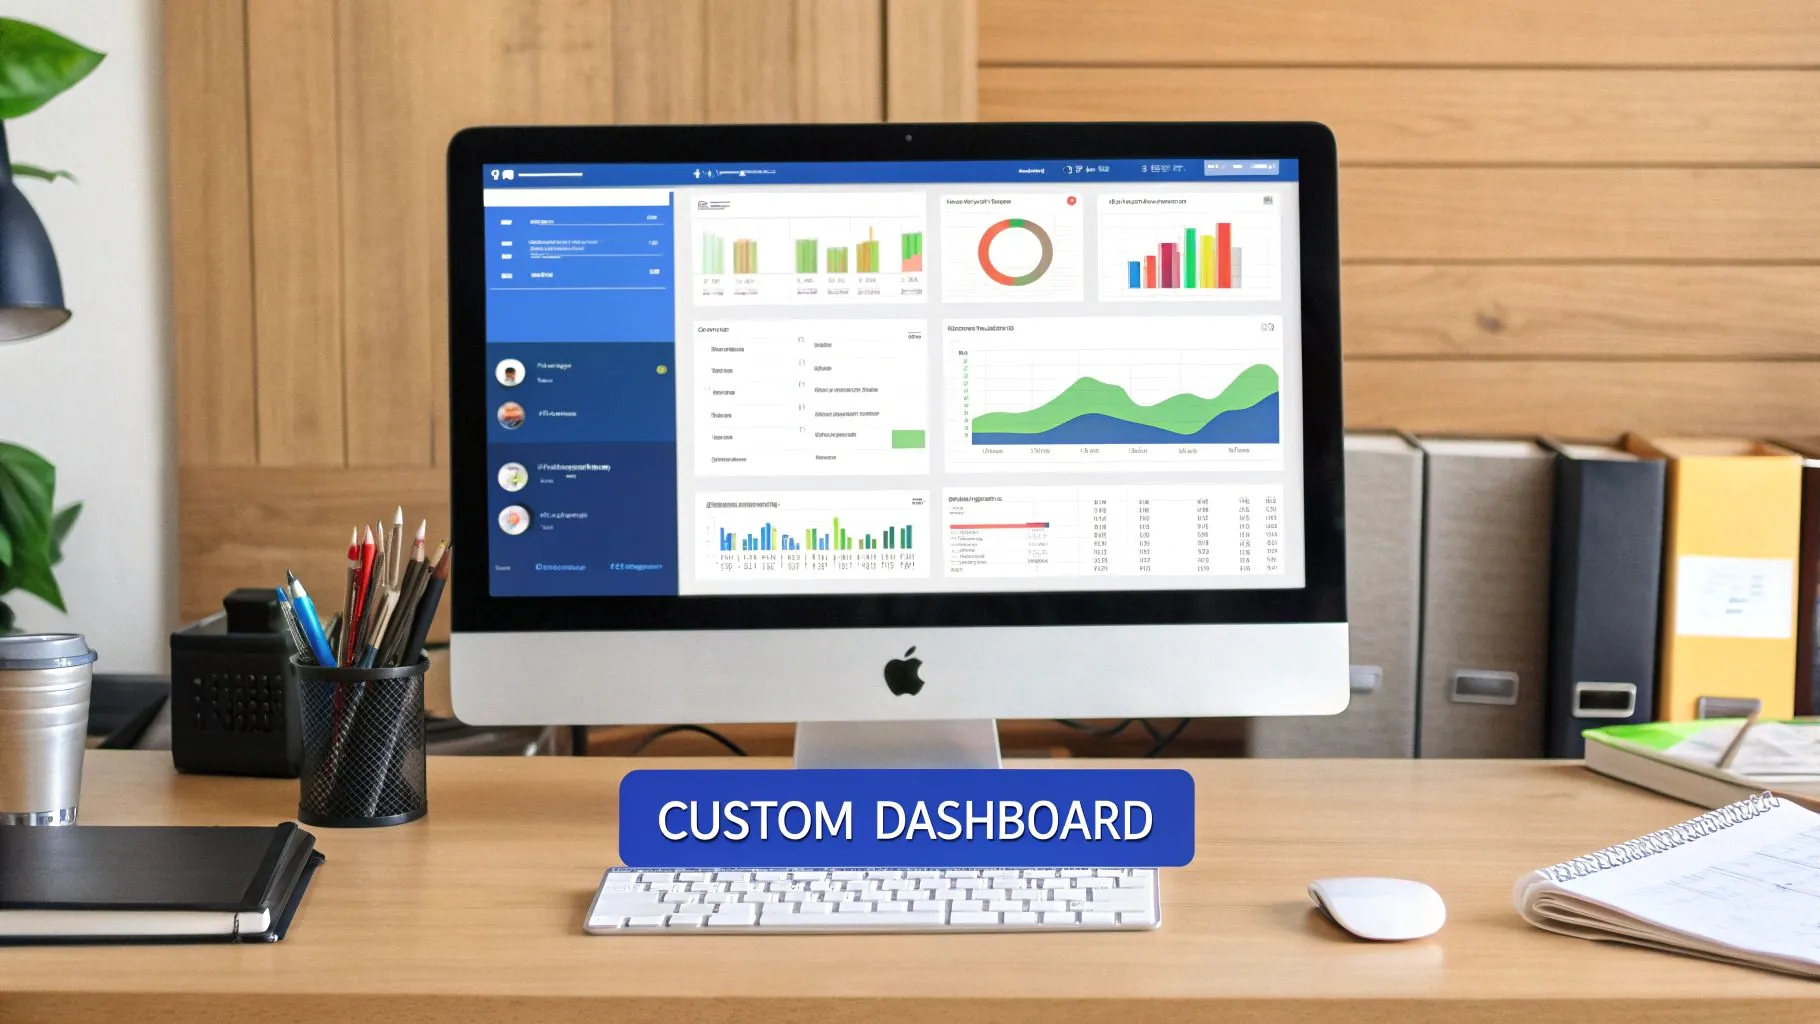
The PopaDex dashboard then pulls all your tracked pairs into one clean, visual interface.
This central hub lets you see historical trends right alongside current rates, making it far easier to spot patterns developing across your whole currency portfolio.
A Real-World Scenario in Action
Let’s go back to our corporate treasurer. One morning, an automated alert from PopaDex hits their inbox: “EUR/USD has dropped 1.2% in the last 3 hours.”
Without that alert, the treasurer might not have caught the dip for hours, possibly after the rate had sunk even lower. Instead, they can jump on it immediately. They log into their dashboard, glance at the trend charts, and decide to execute a forward contract to lock in the current rate for an upcoming payment. Just like that, they’ve shielded the company from further losses.
This single proactive step, triggered by a simple automated alert, can save a company thousands of dollars. It’s the difference between reacting to a financial loss and preventing one from happening in the first place.
This level of automation goes beyond big corporations, either. Whether you’re a freelancer with international clients, an investor, or an e-commerce store owner, setting up smart alerts gives you the power to manage currency risk and grab opportunities with confidence. It frees up your time and mental bandwidth to focus on what you do best, knowing your financial safety nets are always active.
Building Your Custom Currency Dashboard
Automated alerts catch the spikes and dips you care about, but a tailored dashboard brings everything into focus. Think of it as your financial control center—where exchange rate tracking becomes an active part of your strategy rather than background noise.
With PopaDex, you can arrange each currency pair exactly how you want. No two businesses—or traders—operate the same way. Custom layouts ensure you see what matters most.
Selecting Your Key Currency Pairs
Start by narrowing your focus. Too many pairs on one screen means more guessing and less clarity. Zero in on the currencies that move your bottom line.
Consider a retailer sourcing goods from the UK, selling in Japan, and reporting back to the US. Their dashboard might include:
- GBP/USD: Keeps supplier costs and payment timings in check.
- JPY/USD: Tracks sales revenue in real dollars.
- EUR/USD: Monitors overall market mood.
By sticking to these three, they avoid distractions from the Aussie dollar or Swiss franc—currencies that don’t affect their margins.
Choosing The Right Visualization Widgets
Not all charts serve the same purpose. Pair each widget with the insight you need:
- Line Charts: Ideal for spotting long-term trends. A six-month line graph of GBP/USD shows if the pound is generally climbing or falling.
- Candlestick Charts: Delivers daily detail—open, high, low, close—so you can judge volatility at a glance.
- Key Number Displays: Simple, bold, real-time rates front and center for your most critical pair.
For more advanced visualization and analysis within your dashboard, consider how to interpret a comprehensive USD ZAR exchange rate graph.
Your dashboard should answer your most important financial questions in seconds. If you have to spend minutes hunting for information, the layout isn’t working for you.
Mix and match these widgets to build a workflow that feels intuitive. Our e-commerce manager, for instance, might put a live GBP/USD number at the top, a six-month JPY/USD line chart on the left, and an EUR/USD candlestick view on the right.
This setup turns raw numbers into strategic prompts. A sudden dip in JPY alerts them to reprice Japanese orders immediately. A rising GBP signals it’s time to settle invoices in London. That’s the difference between passively watching rates and proactively steering your financial outcomes.
Using Historical Data for Smarter Decisions
Real-time alerts and live dashboards are fantastic for reacting to the market right now. But to make truly strategic moves, you need to look back before you look forward. Diving into historical exchange rate data adds a crucial layer of context to your tracking, turning old information into a powerful tool for forecasting and risk assessment.
This goes beyond glancing at old charts; it’s about decoding the story behind the numbers. Why did a currency spike during a certain quarter? What economic event triggered that sudden dip three years ago? Answering these questions helps you build far more resilient financial models.
Accessing and Interpreting Historical Archives
To get started, you need access to reliable, long-term data. Historical currency exchange rate data is a goldmine for everything from deep economic analysis to routine financial reporting. Platforms like PopaDex often integrate directly with data archives, giving you a seamless way to pull this information right into your workflow.
For instance, OANDA provides access to over 31 years of historical exchange rates for more than 200 currencies, covering a staggering 38,000 forex pairs. These records, which include daily midpoint rates, let you track trends all the way back to January 1990. You can explore these historical currency data archives on OANDA.com.
This historical context helps you spot patterns a real-time feed would completely miss:
- Long-Term Trends: Is a currency in a multi-year uptrend or is it slowly bleeding value?
- Seasonal Patterns: Does a currency pair tend to strengthen or weaken at certain times of the year, like during holiday seasons or specific fiscal quarters?
- Volatility Periods: Pinpoint times when a currency was highly unstable to understand what market conditions might trigger similar behavior in the future.
Turning Past Data into Future Strategy
Let’s walk through a real-world scenario. Imagine a financial analyst reviewing the USD/EUR pair. By pulling up ten years of historical data, they can see exactly how the rate reacted to major economic events, from interest rate hikes by the Federal Reserve to geopolitical flare-ups in Europe.
They might notice that every time a specific type of inflation report is released, the currency pair moves predictably within a certain range for the following 48 hours. This kind of insight is invaluable.
The goal isn’t to predict the future with perfect accuracy, but to understand how a currency behaves under pressure. This knowledge helps you refine your strategy, set more realistic targets, and prepare for potential market shocks.
Armed with this pattern, the analyst can now build it into their financial models, immediately improving their forecasting accuracy. They can also set smarter alerts based on historical volatility levels, giving them an early warning system grounded in years of hard data. This is a crucial element of effectively managing foreign exchange risk.
By combining a live dashboard with deep historical analysis, you move from simply tracking rates to truly understanding the forces that drive them. This complete view empowers you to make smarter, more confident decisions for your business or investment portfolio.
A Few Common Questions
When you start tracking exchange rates, a few questions always pop up. Getting these sorted out is the key to moving from guesswork to making sharp, confident decisions with the right tools in hand.
What Is the Best Source for Live Exchange Rates?
For the most accurate, up-to-the-second data, you need a source that taps directly into the interbank market rate. Think of this as the wholesale price that banks use to trade currencies among themselves—it’s the purest “market value” you can find.
While you can get official rates from central bank websites, those are more like daily snapshots. They aren’t updated nearly often enough for time-sensitive decisions. Tools like PopaDex use live market feeds, giving you a precise, real-time view of what’s happening right now.
How Often Should I Check Exchange Rates?
Honestly, it depends entirely on what’s at stake. If you’re a long-term investor or a business that only makes a few international payments a year, a weekly check-in is probably fine. You’re just looking for the big picture, not the tiny daily ripples.
But if you’re a forex trader or managing an import/export business with daily transactions, those small shifts can make or break your bottom line. In that case, you’ll want to be monitoring rates throughout the day.
The smartest move? Stop checking manually and start automating. Set up alerts for the rates you care about, and let the market tell you when it’s time to pay attention. It’s a huge stress-saver.
Can I Track Crypto and Fiat Currencies Together?
Absolutely. Today’s best financial platforms are built for a world where your portfolio is more than one thing. Services like PopaDex are designed to let you see your traditional (fiat) currencies like USD and EUR right alongside major cryptocurrencies like Bitcoin (BTC) and Ethereum (ETH), all in one dashboard.
You can easily set up alerts and track pairs like BTC/USD or ETH/EUR next to something like GBP/JPY. This gives you a complete, unified view of all your currency holdings, making it far simpler to manage your entire portfolio.
Ready to stop guessing and start tracking your portfolio with powerful, automated tools? See what PopaDex can do for you. Start your free trial today at https://popadex.com.