Our Marketing Team at PopaDex
Create a Net Worth Tracker in Google Sheets – Easy Guide
Key Statistic: According to a 2023 Bankrate survey, 56% of Americans don’t know their net worth. Among those who do track it, 28% use spreadsheets—making Google Sheets one of the most popular DIY tracking methods available.
What is a Net Worth Tracker?
A net worth tracker is a tool that calculates your total financial position by subtracting your liabilities (debts) from your assets (what you own). According to the Federal Reserve’s 2022 Survey of Consumer Finances, the median net worth of American families is $192,900. Tracking this number over time is the foundation of sound financial planning.
Building your own net worth tracker in Google Sheets is a fantastic, free alternative to paid apps, putting you in the driver’s seat of your financial data. It lets you track those unique assets, keep your numbers private, and actually see your progress without another monthly subscription fee hitting your bank account.
Quick Start: Want to skip the setup? Download our ready-made Google Sheets net worth tracker template and start tracking in minutes.
Why Build Your Own Net Worth Tracker
Sure, there are tons of financial apps out there promising to make managing your wealth a breeze, but a growing number of people are taking a different route. Building your net worth tracker in Google Sheets gives you a level of control and personalization that off-the-shelf software just can’t touch. This DIY approach goes beyond dodging subscription fees; it’s about building a system that actually fits your financial life.
And it’s a trend that’s really taking off. Since 2020, we’ve seen a surge of over 40% in Google Sheets template downloads for net worth tracking. It’s a clear signal that people are shifting towards more personalized ways to manage their money. You can find more details about this growing interest right here.
The Power of Total Customization
Most pre-built apps lock you into rigid categories that just don’t work for a diverse portfolio. What are you supposed to do when you need to track assets that don’t fit into a neat little box?
- Cryptocurrency holdings: Let’s be honest, most apps are clumsy when trying to pull in data from various wallets and exchanges.
- Physical collectibles: Got valuable art, watches, or a rare sneaker collection? You need custom fields and manual entry for those.
- Freelance or business assets: A flexible sheet can easily handle the ebb and flow of business income and the value of your equipment.
With your own Google Sheets tracker, you set the rules. You can add, edit, or ditch categories whenever you want, giving you a much more accurate picture of your true wealth.
Gaining Deeper Financial Insight
When you build your own tracker, you connect with your finances on a much deeper level. You’re not just passively glancing at auto-updated numbers; you’re actively involved. A huge reason people build their own tracker is for setting clear financial goals and actually watching the needle move. That hands-on process builds financial discipline and a real gut-level understanding of your money habits.
By manually entering your assets and liabilities, you develop a tangible sense of your financial standing. The process turns abstract numbers into a concrete reality, empowering you to make smarter decisions with your money.
A DIY tracker is way more than a spreadsheet—it’s your personalized tool for financial empowerment. You can learn more about what makes a good net worth tracker in our detailed guide.
Google Sheets Tracker vs Financial Apps
So, what’s the real difference between a DIY sheet and a dedicated app? Here’s a quick breakdown to help you decide which path is right for you.
| Feature | Google Sheets Tracker | Standard Financial App |
|---|---|---|
| Customization | Fully customizable. You build it from scratch to fit your exact needs. | Limited. You’re stuck with their categories and features. |
| Cost | 100% Free. All you need is a Google account. | Often requires a monthly or annual subscription fee. |
| Privacy | High. Your data stays in your personal Google Drive, under your control. | Variable. Many apps use your data for marketing or other purposes. |
| Learning Curve | Moderate. Requires some basic spreadsheet knowledge to set up. | Low. Designed to be user-friendly and intuitive right away. |
| Automation | Manual or semi-automated. You can use scripts, but it takes effort. | Highly automated. Links directly to bank accounts for real-time updates. |
| Unique Assets | Excellent. Easily track collectibles, crypto, or private equity. | Poor. Struggles with anything that isn’t a standard financial account. |
Ultimately, apps are great for convenience and automation, but a Google Sheets tracker offers unmatched control and privacy for those willing to put in a little upfront effort.
If you prefer Microsoft Excel over Google Sheets, check out our Excel net worth tracker template instead.
Laying the Foundation for Your Tracker
Every good spreadsheet starts with a solid, clean structure. Before you can track anything, you need a logical place for your numbers to live. For our net worth tracker in Google Sheets, that means creating a clear separation between what you own and what you owe.
The simplest and most effective way to do this is with two dedicated tabs. Go ahead and create two new sheets at the bottom of your document. Name the first one ‘Assets’ and the second one ‘Liabilities.’
This goes beyond being tidy. This two-tab system forces you to think about your finances in terms of a balance sheet, visually separating the good from the bad. It’s a foundational step that prevents your tracker from becoming a confusing mess of numbers later on.
Building Your Assets Tab
Your ‘Assets’ tab is your personal inventory of everything you own that holds value. This is where you’ll list your cash, investments, property—anything that contributes positively to your net worth. To make this data useful, we need a few specific columns.
Here’s the exact structure I use and recommend for your column headers:
- Category: This lets you group similar items. Think broad buckets like ‘Cash,’ ‘Investments,’ ‘Real Estate,’ or even ‘Collectibles.’
- Item: This is where you get specific. Instead of a generic ‘Savings Account,’ write ‘Ally High-Yield Savings.’
- Current Value: The heart of the tracker. This column holds the most up-to-date market value for each asset.
- Date Updated: Don’t skip this one! Logging when you last updated a value is crucial for maintaining accuracy, especially for assets that fluctuate, like your 401(k).
For example, under your ‘Investments’ category, you might have an item for your ‘Vanguard S&P 500 ETF.’ You’d pop in its current market value and today’s date. For your home, you could grab an estimate from a site like Zillow and note the date you pulled it.
Organizing Your Liabilities Tab
Next up is the ‘Liabilities’ tab. This section is for everything you owe. Getting a complete and honest picture here is absolutely critical for an accurate net worth calculation. To keep things consistent, we’ll use a nearly identical structure to the Assets tab.
Set up your liabilities sheet with these column headers:
- Category: Group your debts into logical categories like ‘Mortgage,’ ‘Student Loans,’ or ‘Credit Card Debt.’
- Item: Be specific about each debt. For instance, ‘Federal Student Loan’ or ‘Amex Gold Card.’
- Current Balance: This is the total outstanding amount you still have to pay off.
- Date Updated: Just like with your assets, you need to track when you last checked this balance.
Pro Tip: For credit card debt, don’t just copy over your last statement balance, especially if you carry a balance from month to month. Log into your account and grab the full, current amount owed for the most precise snapshot of your financial health.
This deliberate setup—separating assets and liabilities into clean, structured tabs—does more than just organize your data. It builds a powerful foundation. Once this groundwork is laid, creating a summary dashboard that automatically calculates your net worth becomes incredibly simple. You’re turning a basic spreadsheet into a dynamic financial tool.
Designing Your Dynamic Financial Dashboard
Alright, your assets and liabilities are neatly organized in their own tabs. Now for the fun part: building the heart of your financial system, the dashboard.
This is a dedicated tab where all your key numbers come together for a clean, at-a-glance summary. The real power of a net worth tracker in Google Sheets goes beyond listing numbers—it’s creating a dashboard that updates automatically. No more manual calculations every month.
Go ahead and create a new tab, naming it something simple like ‘Dashboard.’ This will become your financial command center, showing your most important metrics in one place. It’s where the spreadsheet magic really happens.
Pulling Your Data Together with Formulas
The goal here is total automation. When you update your 401(k) balance in the ‘Assets’ tab, your dashboard should reflect that change instantly. We can make this happen with a few handy Google Sheets formulas, but the star of the show is SUMIF.
The SUMIF formula is perfect for this. It adds up numbers in a range, but only if they meet a specific condition you set. For example, you can tell it to find everything you’ve labeled “Investments” in your ‘Assets’ tab and add up their values.
Let’s see it in action. In your Dashboard tab, set up a simple two-column table. In the first column, list out your main categories (e.g., Cash, Investments, Real Estate). The second column is where the SUMIF formula will do the heavy lifting.
To get your ‘Investments’ total, the formula would look like this:
=SUMIF(Assets!A:A, "Investments", Assets!C:C)
Let’s quickly break that down:
Assets!A:A: This tells the formula to look in the entire ‘Category’ column of your ‘Assets’ sheet."Investments": This is the specific text it’s searching for.Assets!C:C: If it finds a match, it grabs the corresponding value from the ‘Current Value’ column in your ‘Assets’ sheet and adds it to the total.
Key Takeaway: The
SUMIFfunction is the engine driving your dashboard. Once you get the hang of this simple formula, you’ve eliminated manual math and can trust your financial snapshot is always up-to-date.
Calculating Your Key Financial Metrics
Once you’ve used SUMIF to pull the totals for each asset and liability category, the rest is simple arithmetic. Your dashboard needs three headline numbers: Total Assets, Total Liabilities, and your Net Worth.
- Total Assets: This is just a
SUMof all your asset category totals. If your individual asset totals are in cells B2 through B5, the formula is simply=SUM(B2:B5). - Total Liabilities: Do the same thing for your liability categories. If those totals are in cells C2 through C4, the formula is
=SUM(C2:C4). - Your Net Worth: This is the big one! It’s just your total assets minus your total liabilities. Your formula will reference the cells with your grand totals, looking something like
=B6-C5.
The demand for flexible, personal finance tools like this is growing, particularly in financially mature markets. The United States, for instance, holds around 35% of the world’s wealth. This concentration of capital fuels a need for solutions like Google Sheets that can handle diverse portfolios, from stocks to alternative investments. You can dive deeper into this data in the latest Global Wealth Report from UBS.
This automated setup transforms a basic spreadsheet into a genuinely powerful tool. If you want to take this a step further, our guide on building a comprehensive net worth dashboard explores even more advanced visualization techniques. With this structure in place, you’ve officially built a dynamic financial overview.
Visualizing Your Financial Progress
Numbers in a spreadsheet are a great start, but let’s be honest—charts and graphs are what really tell the story. They turn rows of abstract data into a powerful narrative of your financial journey. This is where your net worth tracker Google Sheets goes from being a simple calculator to a genuine motivational tool.
First things first, you need a dedicated tab to log your net worth over time. I like to call mine ‘History’ or ‘Monthly Snapshot.’ At the end of each month, after you’ve updated all your assets and liabilities, you just copy one number over: your total net worth. This simple, two-column log is the fuel for every visualization we’re about to build.
Charting Your Net Worth Growth
With your historical data in place, creating a visual timeline of your progress is surprisingly simple. The most powerful way to do this, in my experience, is with a basic line chart. It gives you an immediate, crystal-clear view of your financial trajectory, showing all the peaks and valleys along the way.
It only takes a few clicks:
- Highlight the two columns in your ‘History’ tab (the Date and the Net Worth).
- Head up to Insert > Chart in the Google Sheets menu.
- Choose the Line Chart option.
This single chart will quickly become your biggest motivator. It’s the visual confirmation that all your hard work—your consistent savings, your smart investments—is actually paying off. Seeing that line climb upward is far more satisfying than just staring at a number in a cell.
It’s also an incredible diagnostic tool. See a sudden dip? That’s your cue to dig deeper. Maybe it’s time to re-evaluate your spending for the month or check on your investment performance. It pushes you to be proactive rather than reactive.
Understanding Your Asset Allocation
Beyond just tracking your total net worth, it’s crucial to understand what that number is actually made of. A pie chart is the perfect tool for visualizing your asset allocation, showing you exactly how your wealth is distributed across different categories like stocks, real estate, and cash.
This infographic shows a pretty standard example, with 50% in stocks, 30% in real estate, and the last 20% in cash.
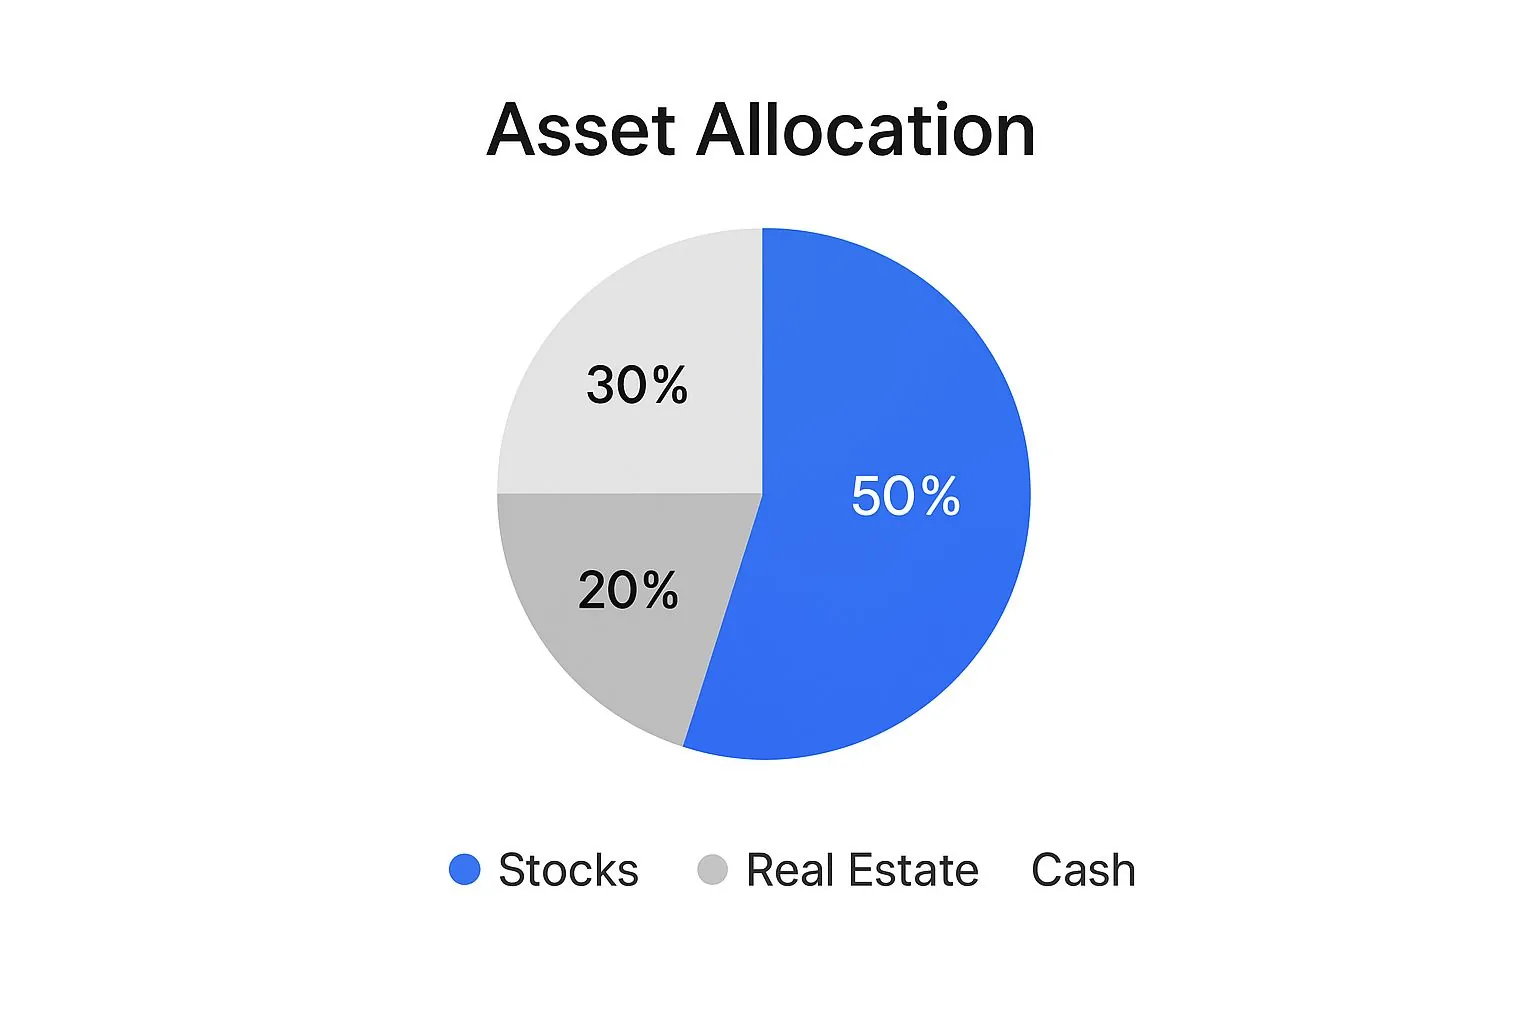
This kind of visualization tells you at a glance if your portfolio is well-diversified or if you’re accidentally over-exposed in one area. If one slice of the pie is overwhelmingly large, it might be a sign to rebalance your investments to mitigate risk. This visual check-in is especially vital for anyone managing assets across different countries.
In fact, with a projected record of 142,000 millionaires expected to relocate internationally in 2025, tools like a Google Sheets tracker become indispensable. Their ability to handle live currency conversions and adapt to new asset distributions is a massive advantage when managing wealth on the move. You can read more about these global wealth shifts in the Henley Private Wealth Migration Report 2025.
Visualizing your finances isn’t just about making pretty charts; it’s about gaining clarity. A well-designed graph can reveal insights that a column of numbers simply cannot, helping you see risks, opportunities, and progress at a single glance.
Visualizations turn your spreadsheet from a static report into a dynamic dashboard. To get you started, here are a few of the most effective charts I rely on to get a complete picture of my financial health.
Essential Charts for Your Financial Tracker
| Chart Type | What It Shows | Best Use Case |
|---|---|---|
| Line Chart | Growth over time | Tracking your net worth month-over-month or year-over-year. |
| Pie Chart | Proportional breakdown | Visualizing your asset allocation (e.g., stocks vs. real estate). |
| Stacked Bar Chart | Composition of totals | Breaking down your monthly expenses or income sources. |
| Waterfall Chart | Cumulative effect of positive/negative values | Showing how your starting net worth changes due to income and expenses. |
These charts are easy to create in Google Sheets and provide immediate, valuable insights that numbers alone just can’t offer.
Automating Your Tracker with Pro Tips
 Manually updating every single asset and liability works, but let’s be honest—it gets old fast. If you want to take your net worth tracker in Google Sheets to the next level, you need a little automation. This is how you transform a static spreadsheet into a dynamic financial dashboard that saves you time and keeps errors at bay.
The most powerful weapon in your arsenal is the GOOGLEFINANCE function. It’s a game-changer. This built-in feature pulls live or historical stock data directly into your sheet, meaning you can stop logging into your brokerage account just to grab the latest price.
Harnessing GOOGLEFINANCE for Live Data
Let’s say you own shares of VOO, the Vanguard S&P 500 ETF. Instead of manually typing in the price every month, you can use a simple formula.
Find the ‘Current Value’ column next to your VOO entry and type this in:
=GOOGLEFINANCE("VOO") * [Number of Shares]
Just replace [Number of Shares] with the actual number you own. Boom. Your tracker now fetches the live market price and calculates the total value for you. This works for thousands of stocks, ETFs, and even major cryptocurrencies (try "BTCUSD" for Bitcoin).
Pro Tip: The data might have a delay of up to 20 minutes, but that’s perfectly fine for net worth tracking. We’re not day trading here; we just need an accurate, hands-off snapshot of our portfolio.
Keeping Your Data Clean with Dropdown Menus
Consistency is everything. If you log an asset under “Investments” one month and “Investment” the next, your dashboard formulas will throw a fit. An easy way to fix this is by using Data Validation to create dropdown menus.
Here’s the quick setup:
- Make a List: On a separate, hidden tab (I usually call mine ‘Lists’), create a single column with all your valid categories: Cash, Investments, Real Estate, etc.
- Apply the Rule: Head back to your ‘Assets’ tab and select the entire ‘Category’ column.
- Set Validation: Go to Data > Data validation. In the criteria, choose “List from a range” and then select the column of categories you just created.
Now, instead of typing, you can just pick a category from a clean, consistent list. This little trick ensures your SUMIF formulas on the dashboard work perfectly every time. These techniques are a fantastic start, and for those who want to go deeper, learning how to automate data entry can completely streamline how you maintain your tracker.
Putting these automations in place drastically cuts down on the manual work and makes your tracker far more reliable. It’s a core principle of effective financial data aggregation, where bringing all your information together seamlessly gives you the clearest possible view of your wealth.
Answering Your Top Questions About Google Sheets Trackers
Building your own net worth tracker in Google Sheets is a fantastic first step. But once the shiny newness wears off, some practical questions always seem to pop up. Let’s dig into the most common ones I hear from people once their tracker is up and running.
How Often Should I Update My Net Worth Tracker?
This is probably the biggest question people have. You’ve got this cool new dashboard, and it’s tempting to check it daily, especially when the stock market is on a rollercoaster. But trust me on this one: a monthly check-in is the sweet spot for most people.
Updating once a month is frequent enough to keep you plugged in and spot real trends, but not so often that you start obsessing over daily market noise. It helps you avoid the anxiety that comes with watching your investments dip by a few dollars one day and jump back the next.
I like to make a ritual out of it. The first Sunday of every month, I grab a coffee, log into my accounts, and spend about 20 minutes plugging in the new numbers. It turns what could be a chore into a moment of reflection on my financial journey.
For most people, a monthly update hits the sweet spot. It’s frequent enough to track progress without becoming an obsession. A full monthly calculation gives you the best view of your long-term trends.
Think of it this way: your net worth is like a ship’s long-term course, not its daily bobbing on the waves. You’re tracking the overall direction, not every little bump.
Is It Safe to Put My Financial Data in Google Sheets?
Security is a totally valid concern. The short answer is yes, Google Sheets is a secure platform, but only if you take a few simple, common-sense precautions. It’s on you to lock the doors.
The single most important thing you can do is enable two-factor authentication (2FA) on your Google account. This adds a critical layer of security that makes it incredibly difficult for anyone to get in, even if they somehow get your password.
Beyond that, here are a few simple rules to live by to protect your privacy:
- Keep sensitive details out: Never, ever put full account numbers, social security numbers, or—and this should be obvious—passwords into your sheet. There’s just no need.
- Use generic labels: Instead of naming an account “Chase Sapphire Checking #123456789,” just call it “Chase Checking.” It’s all you need to know what’s what.
- Lock down your sharing settings: Your tracker should be for your eyes only. Keep it private, never click “Share with anyone with the link,” and only grant direct access to a trusted partner or financial advisor if absolutely necessary.
How Do I Track Assets Without a Live Price Feed?
This is a great question because many of your biggest assets—like your house or your car—don’t have a live ticker you can pull with a GOOGLEFINANCE formula. For these, a periodic manual update is the only way to go.
The key here is consistency, not constant updates.
For your home’s value, popping onto a site like Zillow or Redfin for a ballpark estimate every six months is perfectly fine. For your car, checking the private party value on Kelley Blue Book (KBB) once a year is plenty.
Here’s a pro tip: I always add a “Last Updated” column next to these manual entries. That way, a quick glance tells me if the number is from last week or last year, preventing my net worth from getting skewed by stale data.
Automate Your Net Worth Tracking
Love Google Sheets? PopaDex takes it further with automated tracking and a 4.5% APY digital savings account.
Ready to skip the setup and get a complete financial picture instantly? PopaDex offers an intuitive platform that connects to over 15,000 banks, giving you a real-time, automated view of your entire net worth. Explore our free and premium plans to start tracking your wealth with confidence at https://popadex.com.