Our Marketing Team at PopaDex
How to Calculate Portfolio Return Like a Pro

The simplest way to calculate a portfolio return is to take the final value, subtract the initial value, add any income like dividends, and then divide the whole thing by the initial value. That’s it.
The formula looks like this: (Final Value - Initial Value + Income) / Initial Value.
This works perfectly for a single investment you buy and hold. But the second you start adding or withdrawing cash, this simple calculation starts to fall apart—and can even lie to you.
Why Your Account Balance Is Lying to You
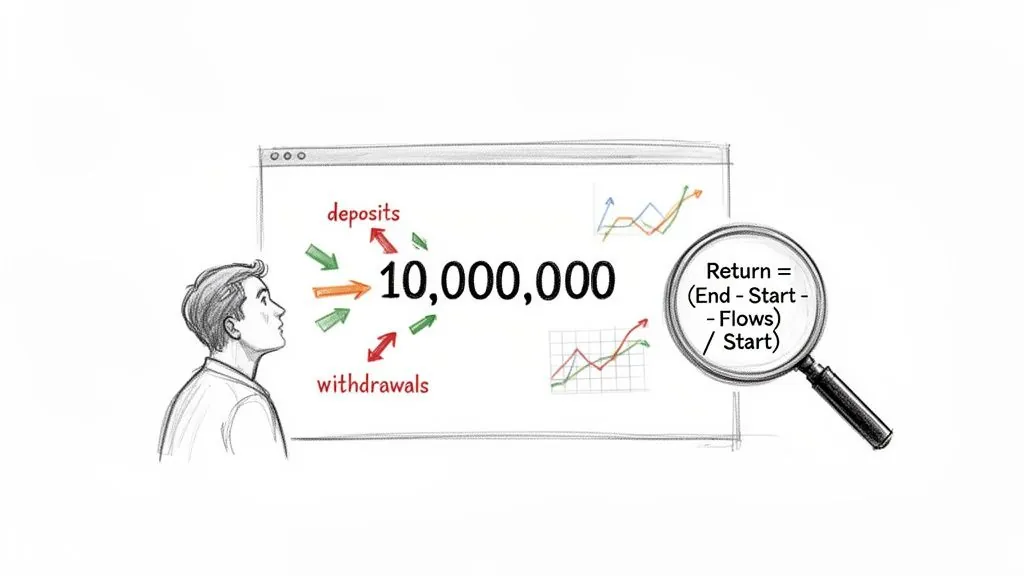
Glancing at your total account balance might feel good, but it’s a terrible way to judge your investment performance. Why? Because a rising balance could just be your own fresh contributions, masking poor returns. A falling balance might hide fantastic underlying growth that was simply overshadowed by a large withdrawal.
This is the central problem: your account value mixes up your investment performance with your cash flow activity.
To make smart decisions, you have to untangle them. Without an accurate return calculation, you’re flying blind. You can’t answer critical questions like:
- Is my strategy actually beating the market? You can’t compare your results to benchmarks like the S&P 500 without a real, standardized return figure.
- Am I timing my contributions well? Understanding how your deposits and withdrawals affect your personal returns is key to optimizing when you put your money to work.
- Am I really on track to hit my goals? Knowing your true rate of growth is the only way to accurately project your future wealth and plan for retirement.
Finding the Right Tool for the Job
The first step is to pick the right measurement for the job. If you’re using a tool like PopaDex to track your multi-currency assets across over 15,000 banks, you have different options at your fingertips.
The most basic metric is the Holding Period Return, which is perfect if you haven’t moved money in or out. For context, the S&P 500 delivered about a 10.3% average annual return from 1957 to 2023 when measured this way. For a deeper dive, check out this comprehensive guide on investment tracking methods.
But once cash starts flowing, you need more sophisticated tools. The two most important methods to know are the Time-Weighted Return (TWR) and the Money-Weighted Return (MWR).
Key Takeaway: TWR measures the performance of your investment strategy, neutralizing the effect of your cash flow timing. MWR measures your personal performance as an investor, reflecting how your timing decisions impacted your final outcome.
Think of it this way: TWR is what a professional fund manager is judged on. MWR is your personal report card. Knowing which one to use, and when, is the secret to truly understanding your financial progress.
Choosing the Right Portfolio Return Method
To make it even clearer, here’s a quick rundown of the main calculation methods, what they measure, and when you should use them.
| Method | What It Measures | Best For |
|---|---|---|
| Simple Return | The total gain or loss on an investment with no cash flows. | A single investment held over a specific period without adding or removing funds. |
| Time-Weighted Return (TWR) | The compound growth rate of your portfolio, ignoring cash flow effects. | Comparing your investment strategy against benchmarks or other fund managers fairly. |
| Money-Weighted Return (MWR) | Your personal rate of return, influenced by the timing of your contributions and withdrawals. | Evaluating your own performance and the real-world return your money generated. |
Each method tells a different part of your financial story. TWR helps you answer, “Was my strategy good?” while MWR helps you answer, “Did I do a good job managing my money?”
Mastering the Basics of Investment Returns
Before we dive into the deep end with complex scenarios like cash flows and compounding, it’s crucial to get a solid grip on the fundamentals. These simple, powerful calculations are the bedrock for understanding how your portfolio is really doing. They bring much-needed clarity, especially when your investment journey is straightforward.
Let’s start with the most basic calculation of all: the Holding Period Return (HPR). This is your go-to metric when you buy an asset, let it ride for a while without touching it, and then want to see how it performed. Think of it as the purest snapshot of an investment’s growth from point A to point B.
Imagine you put $10,000 into a stock. A year later, it’s worth $12,500, and along the way, it paid out $200 in dividends. The HPR formula neatly wraps all of this up to give you a single, total return percentage.
The formula is pretty simple: (Ending Value - Beginning Value + Income) / Beginning Value.
Let’s plug in our numbers: ($12,500 - $10,000 + $200) / $10,000 = $2,700 / $10,000 = 0.27
That gives you a total return of 27% for the period you held the investment. It’s a clean, no-fuss metric that shows exactly how much your initial capital grew, accounting for both price appreciation and any income you received.
Calculating Returns with Dollar-Cost Averaging
Of course, most of us don’t just buy once and forget about it. Many investors regularly contribute to their portfolios—a strategy known as dollar-cost averaging—which means buying shares at different prices over time. This is where the simple Holding Period Return just can’t keep up. You need the Average Cost Method.
This method is essential for figuring out the average price you’ve paid for each share across all your purchases. It’s the only way to accurately know your true cost basis and calculate your real unrealized gains or losses. Without it, you’re essentially flying blind.
Let’s walk through a real-world scenario. Say you’re investing in an S&P 500 ETF, buying shares whenever you have some spare cash:
- January: You buy 10 shares at $150 each (Total: $1,500)
- April: You buy 12 more shares at $160 each (Total: $1,920)
- July: You add another 8 shares at $155 each (Total: $1,240)
To find your average cost, you just add up the total amount you invested and divide it by the total number of shares you own.
Total Invested: $1,500 + $1,920 + $1,240 = $4,660 Total Shares: 10 + 12 + 8 = 30 shares Average Cost Per Share: $4,660 / 30 = $155.33
Now, if the ETF is currently trading at $170 per share, you can instantly see where you stand. Your total holding is worth $5,100 (30 shares x $170), and your unrealized gain is $440 ($5,100 - $4,660). This kind of clarity is impossible without first calculating your average cost.
For anyone using tracking tools like PopaDex, understanding the average cost method is key to seeing your actual gains amid frequent trading. For example, if you buy 5 shares at $180 and 3 more at $186, your average cost becomes $182.25 per share. If the price hits $190, your unrealized gain is $7.75 per share, showing a portfolio gain of 4.25% on your cost basis. This is vital for investors who practice dollar-cost averaging, a strategy that has proven effective with assets like the S&P 500. Learn more about portfolio return analysis.
While mastering these calculations for stocks and ETFs is fundamental, it’s good to know that other asset classes have their own toolkits. For instance, various real estate investment analysis tools help investors evaluate property returns, which often involve completely different metrics. Still, the basic principles of calculating return remain the starting point for any performance review.
Decoding Returns When You Add or Withdraw Money
Simple return calculations work beautifully until you do something completely normal: add or withdraw money. The moment cash moves in or out, that basic formula breaks down, often creating a distorted picture of your actual investment performance.
This is single-handedly the most common point of confusion for investors trying to track their progress accurately.
Depositing a large sum right before a market rally can make your performance look heroic, even if the underlying assets barely moved. On the flip side, withdrawing money just before a significant gain can make an excellent strategy appear weak. To get a true reading, you have to separate your investment decisions from the timing of your cash flows.
This is where two powerful, distinct methods come into play: the Time-Weighted Return (TWR) and the Money-Weighted Return (MWR). Understanding the difference is crucial.
This graphic breaks down the fundamental journey from initial investment to growth and, finally, to calculating your actual performance.
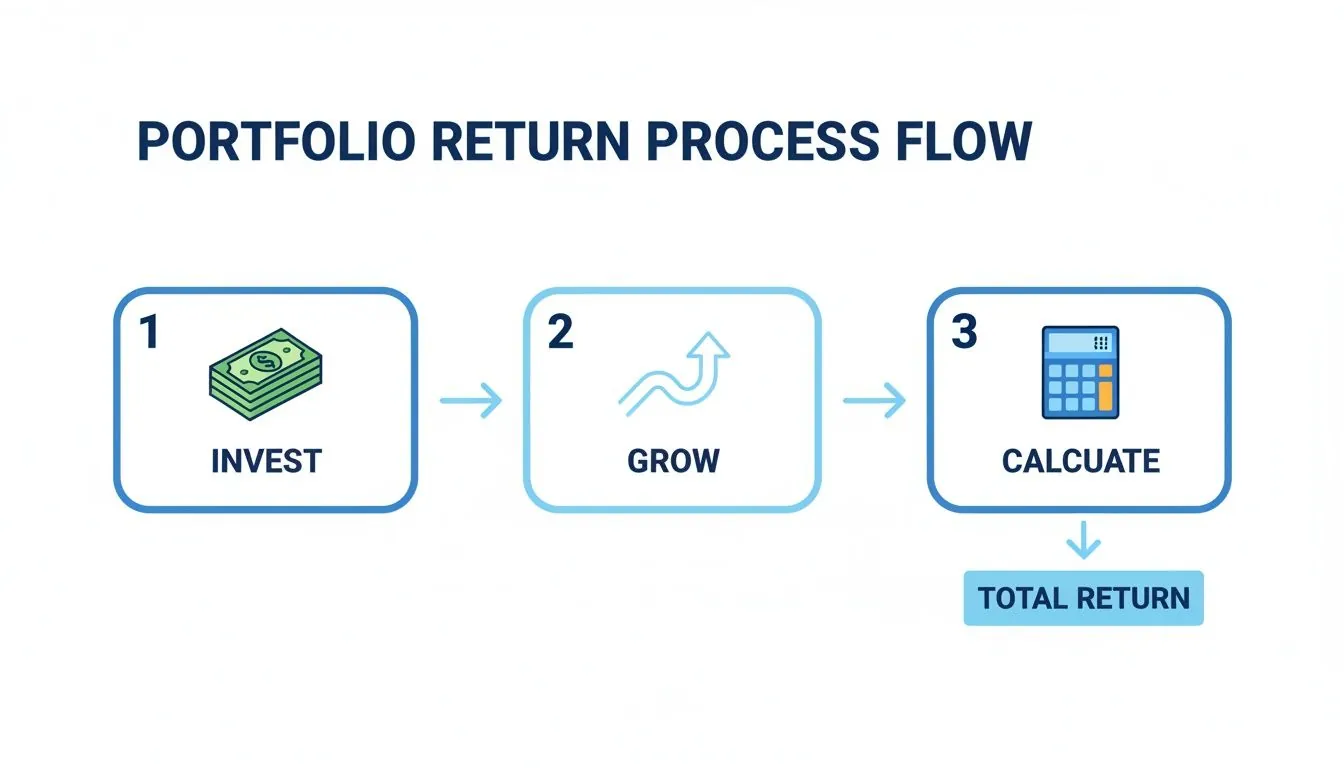
It’s this cycle that TWR and MWR measure in very different ways.
The Analyst’s Choice: Time-Weighted Return (TWR)
The Time-Weighted Return is the industry standard for a reason. It measures the compound growth rate of your portfolio by completely neutralizing the effects of your cash flow decisions.
Think of it this way: TWR answers the question, “How did my investment strategy perform, regardless of when I added or removed money?”
To calculate it, you have to:
- Isolate sub-periods: Break your total investment timeline into smaller chunks. A new period starts every time you make a deposit or withdrawal.
- Calculate the return for each sub-period: Use the simple return formula for each of these individual periods.
- Chain-link the returns: Geometrically link the returns from all sub-periods together to find your final TWR.
This method gives you a fair, apples-to-apples comparison. It’s how you can accurately benchmark your portfolio against an index like the S&P 500, because the index’s performance isn’t affected by your personal deposits.
The Investor’s Reality: Money-Weighted Return (MWR)
While TWR is great for judging a strategy, the Money-Weighted Return tells your personal story. Also known as the Internal Rate of Return (IRR), MWR calculates the actual return on your invested capital, giving full weight to the size and timing of your cash flows.
MWR answers a different, more personal question: “What was my actual return, considering all my decisions to buy, sell, add, or withdraw?”
It effectively finds the interest rate that sets the present value of all your cash inflows equal to the present value of all your outflows. While this sounds complex, spreadsheet programs like Excel and Google Sheets have a built-in XIRR function that does the heavy lifting for you. Our guide on how to calculate return on investment offers a deeper look into similar metrics.
A Tale of Two Returns: A Practical Example
Let’s see how TWR and MWR can produce dramatically different results for the exact same portfolio.
Imagine you start the year with $100,000.
- End of June: The portfolio grows to $110,000 (a 10% gain). Impressed, you deposit another $100,000. Your new balance is $210,000.
- End of December: The market takes a turn, and your portfolio drops to $189,000 (a 10% loss in this second period).
Calculating the Time-Weighted Return (TWR):
- Period 1 Return: ($110,000 / $100,000) - 1 = +10%
- Period 2 Return: ($189,000 / $210,000) - 1 = -10%
- Total TWR: [(1 + 0.10) x (1 - 0.10)] - 1 = -1%
Your TWR is -1%. This tells you that your underlying investment strategy, stripped of your cash flow timing, resulted in a small loss.
Calculating the Money-Weighted Return (MWR):
Your MWR considers that you had more money invested during the downturn. Because your big deposit happened right before the loss, your personal return gets dragged down significantly. The XIRR calculation would show an MWR of approximately -5.8%.
The Verdict: TWR shows your strategy’s performance was basically flat (–1%), but your MWR reveals that your timing was poor, leading to a much larger personal loss of nearly 6%. One metric judges the strategy; the other judges your real-world outcome.
Choosing the right metric depends entirely on what you want to measure. For strategy evaluation, TWR is king. For a true reflection of your personal financial journey, MWR tells the whole story.
Advanced Insights for Long-Term Investors
Once you get a handle on how your own cash flows affect performance, you can start using more powerful metrics. These will give you a much clearer picture of your long-term investing journey. Simple averages are often misleading, swinging wildly with the market’s ups and downs.
For a more stable and meaningful view of your progress over several years, you need to understand the Compound Annual Growth Rate (CAGR).
CAGR is the hypothetical rate of return that would be required for an investment to grow from its beginning balance to its ending balance, assuming the profits were reinvested at the end of each year. It essentially smooths out the peaks and valleys, giving you a single, annualized number.
This is the metric that answers the question, “What has my portfolio’s actual average annual growth been over the last five years, factoring in compounding?” It’s a cornerstone for judging long-term success.
Calculating Your Compound Annual Growth Rate
The CAGR formula might look a bit intimidating, but it’s pretty simple once you see what goes into it. All you need are three numbers: the portfolio’s starting value, its ending value, and the number of years you’re measuring.
The formula is: CAGR = [(Ending Value / Beginning Value) ^ (1 / Number of Years)] - 1
Let’s walk through a real-world example. Imagine you started with a $20,000 portfolio. Five years later, after some great years and a few rough patches, it’s now worth $35,000.
Here’s how to plug those numbers in:
- CAGR = [($35,000 / $20,000) ^ (1 / 5)] - 1
- CAGR = [(1.75) ^ (0.2)] - 1
- CAGR = 1.118 - 1 = 0.118
This gives you a CAGR of 11.8%. Even if one year you were up 25% and another you lost 5%, your smoothed-out, compounded annual return was 11.8%. That number is incredibly useful for projecting future growth with a dose of reality.
A solid CAGR gives you a much more honest assessment of long-term performance than a simple average. It reflects the real compounding effect on your capital, which is the true engine of wealth creation. To see more on how returns build on each other, check out our guide on the cumulative rate of return.
Handling Multi-Currency Portfolios
If you’re an expat, a global investor, or just someone holding assets in different currencies, you’ve got another layer of complexity: currency fluctuations. A 10% gain on a European stock can easily be wiped out if the US dollar strengthens against the Euro.
If you don’t account for exchange rates, you’re not seeing your true, consolidated return. The only way around this is to pick a single base currency and convert everything to that currency before you do any math.
Here’s the game plan:
- Pick Your Base Currency: This is usually your home currency, the one you use for daily life (like USD, EUR, or GBP).
- Convert All Values: On the start and end dates of your measurement period, convert the market value of every foreign asset into your base currency. You’ll need to use the exchange rates for those specific days.
- Calculate the Return: Now that everything is in one currency, you can use any of the standard formulas (Simple, TWR, MWR, or CAGR) to get a genuinely accurate picture of how your global portfolio is performing.
This process is absolutely critical. Without it, you’re not tracking one unified global portfolio; you’re just tracking a bunch of separate ones. This step ensures you know exactly where you stand. For other advanced macro-level metrics, understanding the Dow to Gold ratio for macro market insights can provide valuable context on long-term economic cycles.
Putting Your Portfolio Tracking on Autopilot
Let’s be honest: manually calculating your portfolio return is a brutal task, especially if you’re trying to get an accurate Time-Weighted Return. If you trade frequently, reinvest dividends, or make regular contributions, the complexity snowballs. That meticulously crafted spreadsheet quickly becomes a chore, and one bad formula can wreck your entire analysis.
This is where the DIY approach usually breaks down. Studies have found that nearly 90% of spreadsheets contain errors—a risk that’s just too high when your financial future is on the line. The hours you spend hunting for formula errors and punching in transaction data are hours you’re not spending on actual strategy.
The Power of Automated Tracking
This is exactly why automated portfolio trackers exist. A tool like PopaDex links directly to your brokerage accounts, investment platforms, and bank accounts. Instead of you having to manually log every single buy, sell, and dividend payment, the software just pulls in the data for you.
The real magic is the instant clarity you get. The moment you log in, you see an accurate, up-to-the-minute view of your performance, calculated using the right methods. No more guessing or wrestling with an XIRR function for hours on end.
This PopaDex dashboard, for instance, gives you a clean, consolidated view of all your assets in one place.
This kind of visualization turns raw data into something you can actually use, helping you spot trends and track progress toward your goals without the headache.
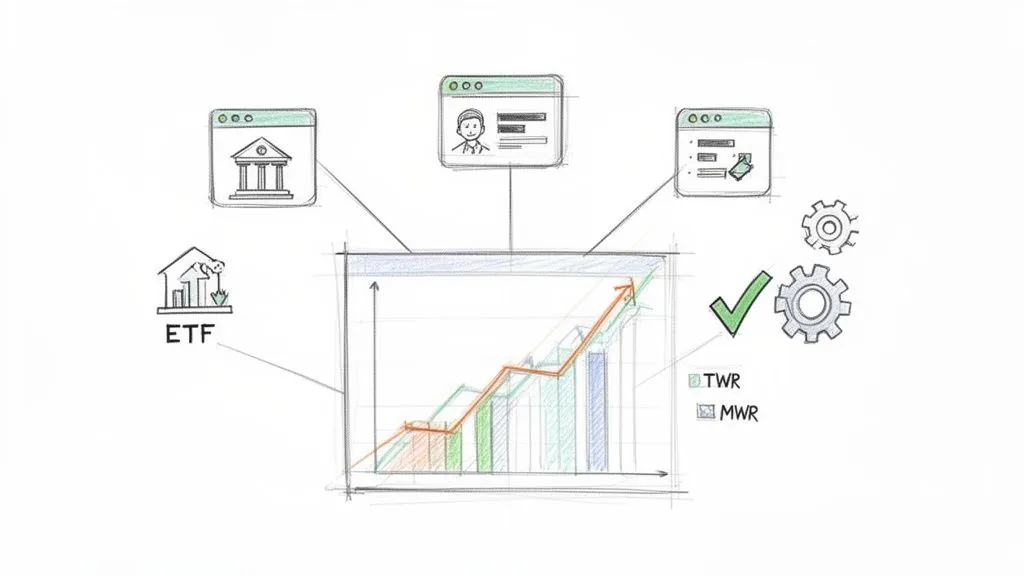
TWR and MWR at a Glance
One of the best things about an automated system is its ability to calculate and show you both TWR and MWR at the same time. As we’ve covered, these two metrics tell very different—but equally important—stories about your investment journey.
- Your TWR dashboard shows how your underlying strategy is performing, completely separate from your cash flow decisions. Think of it as the objective grade for your investment picks.
- Your MWR dashboard gives you the unfiltered truth about your personal return. It shows your real-world outcome, which is heavily influenced by when you decided to invest or withdraw money.
Having both numbers on a simple dashboard lets you diagnose your performance with incredible precision. A high TWR but a low MWR is a dead giveaway that your market timing might need some work, even if your actual asset selection is solid. For those who still prefer a hands-on approach, our guide to building an investment tracking spreadsheet provides templates and tips, but automation is what truly lets you scale your analysis.
Visualize Your Financial Progress
Beyond just the raw numbers, the right tool helps you see the big picture. Interactive charts and graphs aren’t just for show; they’re powerful analytical tools that help you digest complex information in seconds.
With automated tracking, you shift from being a data-entry clerk to a portfolio strategist. Your focus moves from the how of the calculation to the why behind the results, which is where real financial progress is made.
You can instantly:
- Track performance against your goals: See if your current path aligns with your retirement plans or other long-term targets.
- Compare returns across different asset classes: Figure out which parts of your portfolio are driving growth and which might be dragging you down.
- Identify trends over time: Zoom out to see your performance over months or years, which helps smooth out the noise of short-term market swings.
Ultimately, putting your tracking on autopilot isn’t about being lazy—it’s about being smart. It frees you from tedious, error-prone manual work, giving you back the time and mental energy to focus on what really matters: making better, more informed decisions with your money.
Common Questions About Portfolio Returns
Even after you’ve crunched the numbers, it’s completely normal to have more questions than answers. You’re not alone if you’ve ever felt stuck when the figures on your brokerage statement don’t quite line up with your own calculations.
Let’s walk through some of the most common points of confusion. Getting these cleared up is the final step to feeling confident in how you measure your financial progress.
Which Return Method Is Best for Me?
This is easily the most frequent question, and the answer always comes back to one thing: what are you trying to measure? There’s no single “best” method, just the right tool for a specific job.
Here’s a simple way to think about it:
- To judge your strategy: Use the Time-Weighted Return (TWR). This is your go-to for an apples-to-apples comparison against a benchmark like the S&P 500. It strips out the effects of when you added or withdrew cash, showing only the performance of the underlying investments.
- To judge your personal performance: Use the Money-Weighted Return (MWR). This method tells the real-world story of your own investment journey, including the impact of your timing. It answers the question, “How did I do with the money I invested?”
Frankly, most savvy investors look at both. A high TWR shows your investment picks are solid, while a strong MWR proves your timing for adding capital was also on point.
How Do Dividends and Fees Factor In?
They are absolutely critical. Ignoring them gives you a distorted and incomplete picture of your actual performance. It’s a common mistake, but an easy one to fix.
Dividends, interest, and any other income should always be added to your total return. They are a core part of your earnings—think of them as cash your investments generated for you.
On the flip side, all costs must be subtracted. This includes transaction fees, advisory fees, account charges, and any other expenses you run into. Your real return is the net profit you actually get to keep.
Key Insight: Your true portfolio return is what’s left after accounting for every dollar that came in (like dividends) and every dollar that went out (like fees). Anything less is just an estimate.
Why Doesn’t My Broker’s Number Match Mine?
This one trips up almost everyone, but there’s usually a simple explanation. Most brokerage platforms default to showing you a Time-Weighted Return (TWR). They do this because TWR is the industry standard for evaluating a fund manager or a specific investment strategy.
Your actual, personal return, however, might be quite different.
For instance, if you made a huge deposit right before a market rally, your personal Money-Weighted Return (MWR) would be much higher than the TWR your broker shows. The opposite is also true. Always dig into your brokerage statement’s fine print or settings to see exactly which method they’re using for their performance figures.
Can I Calculate This in a Spreadsheet?
Yes, you absolutely can, but the difficulty ranges from “pretty easy” to “a complete nightmare.”
Simple returns are straightforward. For MWR, both Excel and Google Sheets have a built-in XIRR function that works perfectly. You just need a column of dates and a column of your cash flows (deposits as positive numbers, withdrawals as negative).
Calculating TWR, though, is the real challenge. It requires you to create sub-periods for every single cash flow and then chain-link the returns for each period. While it’s technically possible in a spreadsheet, it is incredibly tedious and highly prone to error. This is where manual effort gets out of hand and automated tools can save you a ton of time and prevent costly mistakes.
Stop wrestling with spreadsheets. Get instant, accurate insights into your portfolio’s performance.
With PopaDex, you can automatically track your TWR, MWR, and overall net worth across all your accounts in one simple dashboard. Take control of your financial future by signing up at https://popadex.com.