Our Marketing Team at PopaDex
How to Calculate Return on Investment A Complete Guide
When it comes to your investments, guesswork is your worst enemy. The only way to know what’s truly working is to calculate your Return on Investment (ROI). It’s the simplest, most direct way to measure performance.
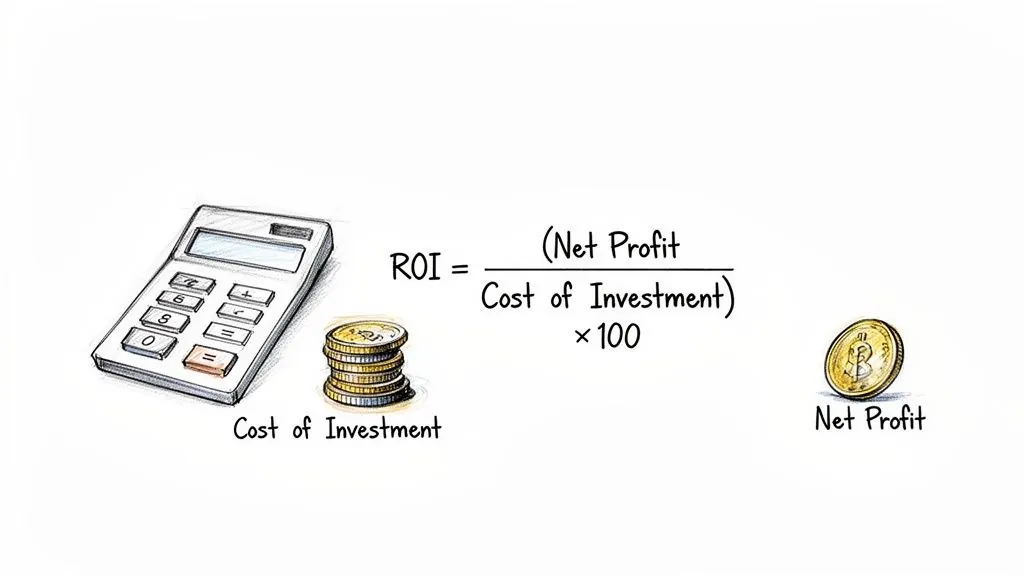
The basic formula is straightforward: (Net Profit / Cost of Investment) x 100.
This simple percentage cuts through the noise and answers the most important question for any investor: “For every dollar I put in, how much did I get back?” It’s the ultimate yardstick for comparing wildly different opportunities, whether you’re looking at stocks, a rental property, or even a new piece of equipment for your business.
Breaking Down the ROI Formula
Let’s unpack the two key pieces of the puzzle. It’s simpler than you think.
- Net Profit: This is what you walk away with after you’ve covered your initial outlay. To find it, just subtract your original cost from the final sale price. If you bought a stock for $1,000 and sold it for $1,200, your net profit is a cool $200.
- Cost of Investment: This one’s easy—it’s the total price you paid to get the asset in the first place. In our stock example, that’s the initial $1,000.
Now, let’s plug those numbers into the formula: ($200 / $1,000) x 100.
That gives you a 20% ROI. Plain and simple, your investment grew by 20%. For a deeper dive into the fundamentals, you can learn more about how to calculate total return on investment.
The real power of ROI is its ability to standardize performance. It turns every investment’s success—or failure—into a single percentage. This removes all the ambiguity and lets you compare apples to oranges, focusing only on what matters: the results.
To make this even clearer, here’s a quick breakdown of how the numbers work in our example.
Key Components of the Basic ROI Formula
This table breaks down each element of the standard ROI calculation for quick reference.
| Component | Definition | Example (Based on a $1,000 investment sold for $1,200) |
|---|---|---|
| Final Value | The market value of the investment when it was sold or measured. | $1,200 |
| Cost of Investment | The original price paid for the investment. | $1,000 |
| Net Profit | The difference between the final value and the initial cost. | $1,200 - $1,000 = $200 |
| ROI Percentage | The net profit divided by the cost, expressed as a percentage. | ($200 / $1,000) x 100 = 20% |
With these components, you have everything you need to calculate the performance of any basic, single-period investment.
Putting the ROI Formula to Work with Real Examples
Knowing the formula is one thing, but true confidence comes from seeing it in action. Let’s get our hands dirty and apply the return on investment formula to a few scenarios you’re likely to encounter. While every investment has its own quirks, you’ll see that the core logic never changes.
We’ll kick things off with a simple stock purchase and then dive into more complex situations where meticulous cost tracking is the secret to finding your real return.
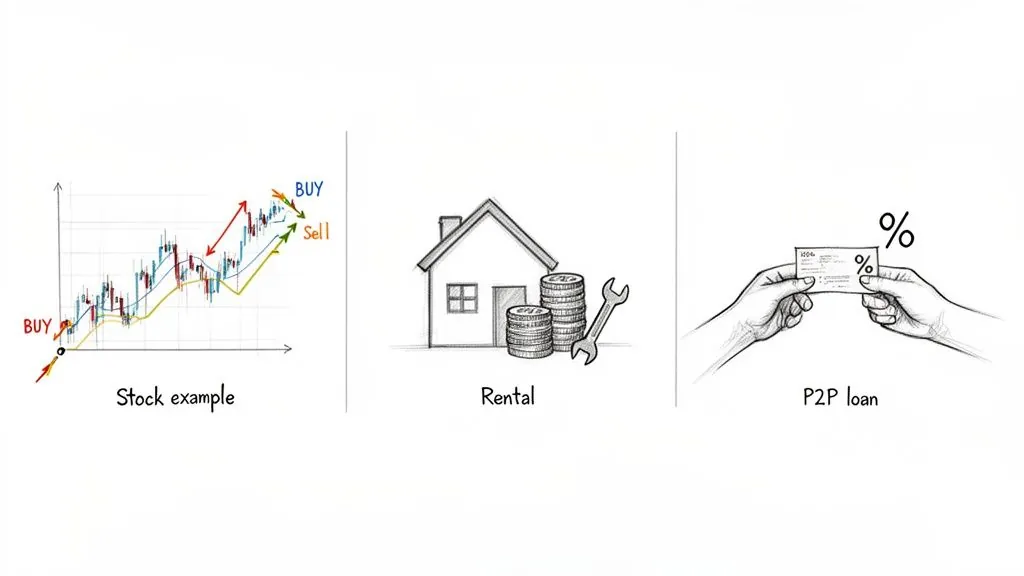
Calculating ROI on a Stock Purchase
Let’s say you buy 100 shares of a tech company at $50 per share. Your initial investment, or cost basis, is easy enough to figure out: 100 shares × $50/share = $5,000.
A year goes by, the stock price climbs to $65 per share, and you decide it’s time to sell.
Your total sale value comes to 100 shares × $65/share = $6,500. Now, we can pinpoint your net profit.
- Final Value: $6,500
- Initial Cost: $5,000
- Net Profit: $6,500 - $5,000 = $1,500
With those numbers in hand, we just plug them into our trusty ROI formula:
( $1,500 Net Profit / $5,000 Cost of Investment ) × 100 = 30% ROI
This is a pretty clean example. Just remember, in the real world, you’d need to factor in any trading fees. Those fees get added to your cost, which would nudge your final ROI down a bit.
Calculating ROI on a Rental Property
Real estate always brings more variables into the mix. Imagine you buy a rental property for $250,000. Over the first year, you collect a solid $24,000 in rent. But your costs extend far beyond that initial purchase price.
To find your true operational profit, you have to track all your ongoing expenses. This is non-negotiable. These usually include things like:
- Property Taxes: $4,000
- Insurance: $1,200
- Maintenance and Repairs: $2,000
- Property Management Fees: $2,400
Add those up, and your total annual operating costs are $9,600. This means your net operating profit for the year is $24,000 (Rent) - $9,600 (Expenses) = $14,400.
To calculate the annual ROI from your rental income—often called the capitalization or “cap” rate—you use this net profit figure.
( $14,400 Net Profit / $250,000 Cost of Investment ) × 100 = 5.76% ROI
Keep in mind, this specific calculation only looks at the cash flow. It doesn’t include the property’s appreciation in value, which would be a whole separate component of your total return when you eventually sell.
Calculating ROI from Peer-to-Peer Lending
Peer-to-peer (P2P) lending generates returns in a different way: through interest. Suppose you invest $2,000 on a P2P lending platform, spreading your money across a portfolio of different loans to diversify your risk.
Over the year, you receive $240 in interest payments from the borrowers. Great! But there are other factors. The platform charges a 1% service fee on the interest you earn, and unfortunately, one of your loans defaults, leading to a $50 loss.
When calculating ROI for assets like P2P loans, you have to subtract all associated fees and losses from your gross earnings. Overlooking these little details is a classic mistake that gives you a misleadingly high ROI.
First, let’s get to your true net profit:
- Gross Interest Earned: $240
- Service Fees (1% of $240): $2.40
- Losses from Default: $50
- Net Profit: $240 - $2.40 - $50 = $187.60
Now you have the right number to calculate your real ROI:
( $187.60 Net Profit / $2,000 Cost of Investment ) × 100 = 9.38% ROI
As you can see, the basic formula is flexible. The real key, no matter the investment, is to be a hawk about tracking every single dollar that goes in and every dollar that comes out.
Looking Beyond Basic ROI With Annualized Returns
A 20% return on investment sounds fantastic, but that number by itself is missing a critical piece of the puzzle: time. Did it take one year to hit that 20% gain, or did it take five? The answer completely changes how you should feel about that investment’s performance, and it’s a blind spot for the basic ROI formula.
Simple ROI gives you a snapshot—the total growth from start to finish. For a deeper dive into this total growth, check out our guide on the cumulative rate of return. But it totally ignores the journey and how long it took you to get there.
To make any kind of meaningful comparison, especially when you’re looking at long-term goals, you have to standardize your returns. That’s exactly what annualized ROI does.
Why Annualizing Your Returns Is a Game Changer
Annualizing boils down your performance to an average rate of return per year. This gives you an incredibly powerful tool for making true apples-to-apples comparisons. It smooths everything out over the entire holding period, giving you a single, comparable yearly figure.
Let’s walk through a real-world scenario. Imagine you made two different investments:
- Investment A: You put in $10,000 and cashed out at $12,000 after 2 years. The simple ROI is a solid 20%.
- Investment B: You invested $5,000 and sold for $6,000 after just 6 months (0.5 years). The simple ROI is also 20%.
On the surface, they look identical. But once we annualize them, a very different story emerges. Investment A’s annualized return works out to about 9.5%, while Investment B’s comes in at a massive 44%. Suddenly, Investment B looks far more effective at building wealth.
By leveling the playing field, annualization uncovers the true efficiency of your capital. It shifts the focus from “how much did I make?” to the more insightful question: “how effectively did my money work for me each year?”
How to Calculate Annualized ROI
The formula for Annualized ROI might look a bit intimidating at first glance, but the concept behind it is actually pretty simple. You’re just adjusting the basic ROI figure for the number of years the investment was held.
Here’s the formula: Annualized ROI = [ (1 + Simple ROI) ^ (1 / N) ] - 1
In this equation, N is just the number of years you held the asset.
Let’s plug in the numbers for Investment A from our example:
- Get the Simple ROI: ( ($12,000 - $10,000) / $10,000 ) = 0.20
- Add 1: 1 + 0.20 = 1.20
- Find N: The holding period was 2 years, so N = 2.
- Calculate the Exponent: 1 / 2 = 0.5
- Apply the Exponent: 1.20 ^ 0.5 = 1.0954
- Subtract 1 and Convert to a Percentage: 1.0954 - 1 = 0.0954, which is 9.54% Annualized ROI.
This confirms that even with a 20% total return, the investment’s actual performance was like gaining about 9.54% each year.
The role of time in these calculations can’t be overstated. Just look at the historical data for major indices. Over the past 10 years (2014-2024), the S&P 500 has delivered annualized returns of 11.01%, but its 150-year average is closer to 9.35%. These numbers show why knowing how to calculate return on investment over specific time horizons is so important for setting realistic expectations. You can discover more insights about historical stock market returns on tradethatswing.com.
Calculating ROI in Complex Scenarios
Let’s be real: investing is rarely as simple as buying something once and watching it grow. The basic and annualized formulas are great for a quick snapshot, but serious portfolios are dynamic. You add money, reinvest dividends, and deal with pesky costs that chip away at your actual returns.
Knowing how to calculate your return on investment in these messier, more realistic situations is what separates a casual observer from a savvy investor.
This quick flowchart breaks down the essential steps for standardizing a return over a specific timeframe.
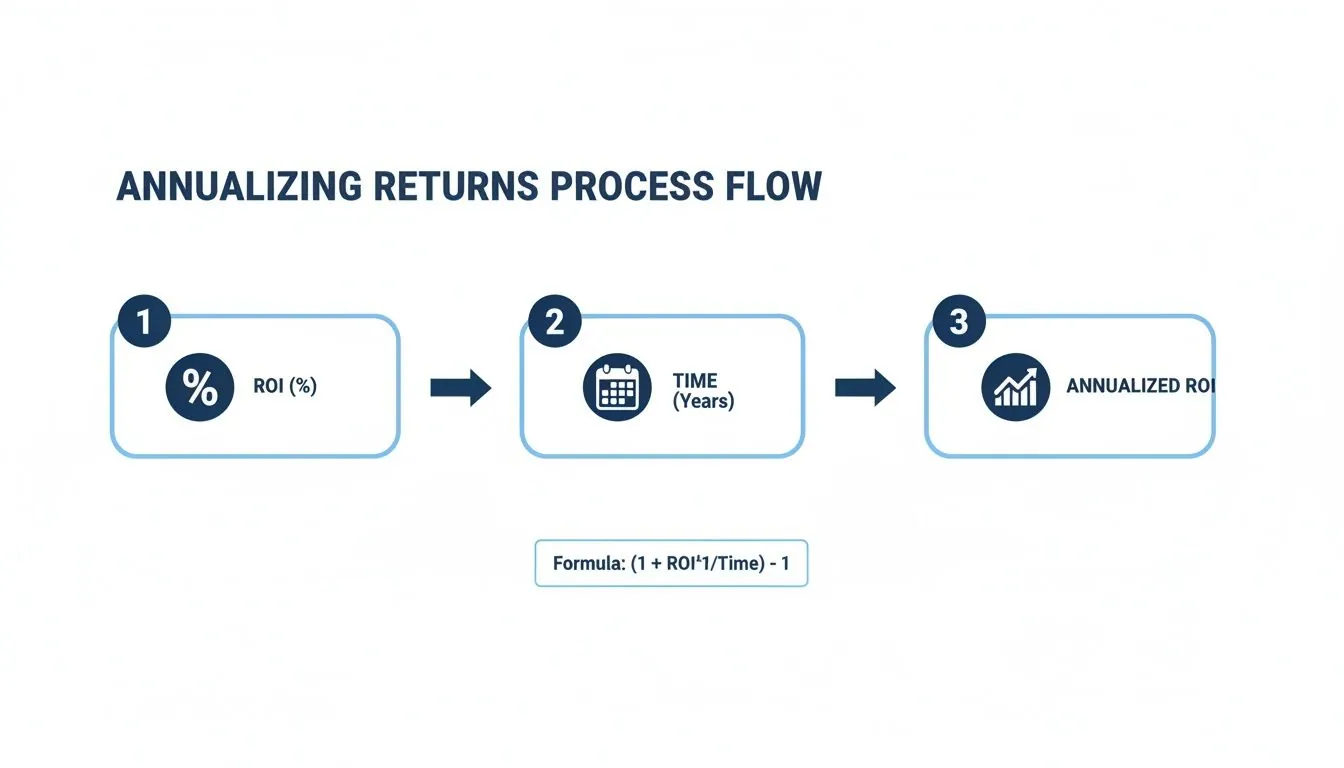
It essentially shows how to turn a simple ROI percentage into a comparable annualized figure by factoring in how long you held the investment.
Accounting for Fees and Taxes
Transaction fees, management fees, and capital gains taxes are the silent killers of a portfolio. They’re direct costs that have to be subtracted from your gains (or added to your losses) to find your true net profit. If you ignore them, you’re just looking at an inflated, inaccurate ROI.
For instance, say you sold a stock for a $1,000 profit. Nice! But if you paid $10 in trading fees and will owe $150 in capital gains tax, your real net profit is only $840. This detail is crucial for tracking your actual performance and is a key part of learning how to properly evaluate investment opportunities.
Managing Multi-Currency Investments
Investing across borders brings currency fluctuations into the mix—a whole other layer of complexity. An investment might be booming in its local currency but turn into a loss when you convert it back to your own. The reverse can happen, too. That’s why you have to calculate returns in both the local and home currencies to get the full story.
International markets make this point loud and clear. Over the past five years as of December 2025, Argentina posted an incredible annualized return of 26.26%, while New Zealand came in at a dismal -5.70%. That massive 31.96 percentage point gap shows just how much geography matters. And when you factor in currency movements on top of that, your final return can shift dramatically.
Key Takeaway: For global portfolios, your total ROI is a combination of asset performance and currency exchange rate movements. Track them separately to know what’s truly driving your returns.
Handling Contributions and Withdrawals
What happens when you regularly add money to an investment, like with a retirement account or a dollar-cost averaging strategy? The standard ROI formula falls apart here because your “cost of investment” is constantly changing. For these scenarios, you need a more powerful tool: the Internal Rate of Return (IRR).
IRR is a fantastic metric that calculates the true annualized rate of return for a series of cash flows—both money in and money out—over time. While the manual math is a headache, spreadsheet programs like Excel or Google Sheets have a built-in IRR function that does the heavy lifting for you.
Here’s how you’d set it up:
- List your initial investment as a negative number (a cash outflow).
- Add all your later contributions as negative numbers on their respective dates.
- List any money you took out (withdrawals) as positive numbers.
- Finally, enter the investment’s final market value as a positive number at the end date.
The IRR function will spit out a single percentage that represents your actual, time-weighted annual return. This is incredibly useful in complex financial situations. For example, business owners often face unique challenges, and applying advanced ROI calculations is essential for things like retirement planning for business owners.
Stop Calculating ROI by Hand—There’s a Better Way
Let’s be honest: manually calculating the return on investment for every single asset you own is a nightmare. It’s not just tedious; it’s a surefire way to make mistakes. As your portfolio expands with different stocks, properties, and other investments, the complexity quickly gets out of hand.
Spreadsheets can feel like a good starting point, and you can even grab our simple investment tracking spreadsheet to get a taste of it. But you’ll soon find that they become a tangled mess, and just keeping them updated feels like a part-time job.
This is exactly why a smarter approach is necessary. Modern net worth trackers like PopaDex are built to take this manual grind completely off your plate. Instead of you hunting down numbers, the tool does the heavy lifting for you.
How Automated Aggregation Works Its Magic
These platforms work by securely connecting to your financial accounts—brokerages, banks, crypto exchanges, you name it—using secure, read-only APIs. This connection lets the software automatically pull in your transaction history, current balances, and cost basis information in real-time.
Once all that data is in one place, the real magic happens. The platform crunches the numbers for you, calculating the key performance metrics that actually matter. This includes:
- Total Return on Investment (ROI) for individual assets and your entire portfolio.
- Time-Weighted Return (TWR), which is perfect for measuring performance without the noise of your own contributions and withdrawals.
- Internal Rate of Return (IRR), which gives you the full picture by factoring in the timing of all your cash flows.
The point of automating these calculations isn’t just about saving hours of mind-numbing work. It’s about achieving a level of accuracy that’s nearly impossible to get right by hand. This frees you up to think about strategy instead of being bogged down in data entry.
From Numbers to Insights: Visualizing Your Progress
The biggest win with these tools is how they turn endless rows of data into clear, interactive visuals. Instead of squinting at a spreadsheet, you get intuitive dashboards that bring your portfolio’s story to life.
This screenshot from the PopaDex dashboard, for instance, shows how your net worth and asset allocation can be tracked visually over time.
This visual approach makes it incredibly easy to spot trends, see how different assets are performing against each other, and get a big-picture view of your financial health with just a glance.
Seeing performance over different timeframes is also crucial. Historical data shows just how much stock market returns can swing depending on when you measure; the S&P 500 averaged 10.463% annually over 100 years, but 11.621% over the past 50. This is a great reminder of how economic cycles and major world events shape returns. A good tracker helps you analyze these periods and set realistic expectations for each part of your portfolio. You can discover more insights about historical returns on Novel Investor. This kind of data-driven clarity is essential for making smart decisions and staying on track with your goals, all without the manual grind.
Common Questions About Calculating ROI
Once you get the formulas down, the real world of investing always throws a few curveballs. You start plugging in your own numbers, and suddenly, questions pop up. It’s totally normal—what looks simple on paper can get tricky when it’s your own money on the line.
Let’s walk through some of the most common sticking points investors run into. Getting these sorted will help you calculate your returns with a lot more confidence.
What Is a Good ROI for My Investments?
This is the big one, and the honest answer is: it depends. There’s no magic number for a “good” ROI because it’s all about context. The right return for a sleepy government bond would be a disaster for a risky tech startup.
A common yardstick people use is the historical average of the S&P 500, which usually lands somewhere around 9-10% annually. But even that is just a benchmark, not a rule.
Think about it this way:
- Conservative Investments: For something super safe like a high-quality government bond, you might be happy with a 3-5% ROI. You’re trading high returns for low risk.
- High-Risk Ventures: If you’re backing a venture capital fund, you’re taking a huge gamble. Those investors are often looking for returns of 25% or more to make the risk worthwhile.
The smart move is to measure your ROI against the right things: relevant benchmarks for that specific asset class and, most importantly, your own financial goals. If your stock portfolio is up 7% but the market as a whole jumped 12%, you might be underperforming.
The goal isn’t to hit some universal “good” number. It’s to make sure your return is a fair reward for the risk you’re taking and is moving you closer to where you want to be financially.
How Do I Calculate ROI If I Reinvest Dividends?
Great question. Reinvested dividends are one of the most powerful ways to build wealth, so you absolutely have to count them. When you reinvest, that dividend payout buys more shares of the asset. This is a game-changer for your calculation.
Each time a dividend is reinvested, you need to treat it like a tiny new investment. This means your total “cost” isn’t just your initial purchase anymore. It’s your initial investment plus all those reinvested dividends added together. Your “Final Value” is just what all your shares—the ones you originally bought and the new ones from dividends—are worth today.
Honestly, this is where automated tracking tools become a lifesaver. Doing this manually for years of dividends is a headache, but a good platform handles these cost basis adjustments for you without a second thought.
Does ROI Account for Inflation?
Nope. The standard ROI formula gives you the nominal return, not the real return. It tells you how much your money grew in number, but it doesn’t account for how much purchasing power that money lost to inflation over the same period.
To get your “real” ROI, you have to factor inflation in. A quick-and-dirty way to do this is to just subtract the annual inflation rate from your nominal ROI.
For example, if your portfolio returned 8% for the year but inflation was running at 3%, your real return is roughly 5%. That 5% is a much truer picture of how much your wealth actually grew.
Can ROI Be Negative and What Does It Mean?
Absolutely. ROI can definitely be negative, and it’s not the end of the world. A negative ROI just means you lost money on an investment—the final value was less than what you paid.
Let’s say you invested $1,000 into a stock and had to sell it for $800. Your net profit is -$200. The math is simple: (-$200 / $1,000) x 100 gives you a -20% ROI.
No one likes seeing a negative number, but it’s a completely normal part of investing. Every loss is a lesson. Figuring out why an investment didn’t work out is one of the best ways to sharpen your strategy for the future.
Ready to stop crunching numbers by hand and see your true ROI in real-time? PopaDex automates all these complex calculations by connecting to your accounts, giving you a clear, visual dashboard of your entire financial life. Take control of your portfolio and start making smarter, data-driven decisions today. Explore PopaDex now.