Our Marketing Team at PopaDex
A Practical Guide to Understanding Financial Reporting
Getting a handle on financial reporting is the single best way to get a true, unfiltered look at your financial health. This isn’t just something for big corporations; it’s a powerful skill that turns a confusing mess of numbers into a clear story about your personal wealth, your progress, and where the real opportunities lie.
Why Understanding Financial Reporting Is Your Secret Weapon
A lot of people hear “financial reporting” and immediately think of accountants buried in spreadsheets or Wall Street analysts. The truth is, the core ideas behind it are your most direct path to financial clarity and control.
Think of it like a personal ‘State of the Union’ for your money. It lays out the unvarnished truth about where you stand today and, more importantly, where you’re headed. Without it, you’re flying blind, making big decisions based on a quick glance at your bank balance or just pure guesswork. That’s a recipe for missed opportunities or, even worse, stumbling into financial trouble you never saw coming.
A Roadmap for Your Financial Goals
When you know how to read your own financial reports, you gain an incredible advantage. It gives you the hard data you need to make smart decisions and chase down your biggest goals with confidence. This one skill helps you:
- Track Your Progress Accurately: See exactly how your net worth is growing over time. You’ll know which strategies are actually working and which ones are just spinning their wheels.
- Make Smarter Decisions: Figure out if you can really afford that house, or see if you’re actually on track to retire early. The numbers don’t lie.
- Achieve Financial Freedom: Build a clear, actionable plan based on real figures, not just wishful thinking and rough estimates.
The very same concepts that giant companies use to measure their success can give you a crystal-clear picture of your own financial journey.
The Evolution of Financial Reporting
The financial world is always changing, and reporting standards are constantly adapting. This isn’t some abstract trend that only affects corporations; it has a direct impact on how your own financial information is managed and understood.
For example, there’s a huge global push for standardized ways to measure financial health that go way beyond simple profit and loss. Sustainable finance initiatives, for instance, are now tracked across 72 emerging markets using updated frameworks, which signals a massive shift toward more comprehensive data. You can dive deeper into this global trend in the 2025 Global Progress Report from SBFN. For you, this just underscores the growing importance of having your own financial picture consolidated and accurately reported.
Modern tools like PopaDex cut through all this complexity. They take what used to be an intimidating chore and turn it into an automated, insightful experience, transforming your raw data into a clear roadmap for your financial future.
The Three Financial Statements That Tell Your Story
To really get a grip on your finances, you need to get familiar with the “Big Three” reports that form the bedrock of financial reporting. These aren’t just stuffy, corporate documents; they’re the chapters of your financial story, each one revealing a crucial part of the plot. Once you learn how to read them, you can stop guessing about where your money is going and start knowing exactly where you stand.
Think of them as different camera angles on your financial life. One gives you a wide, static shot of your overall position. Another shows the action and drama over a period of time. And the last one follows the cash to see where it really ends up. Together, they paint the complete picture that a platform like PopaDex uses to build your real-time net worth dashboard.
Let’s break them down.
Here’s a quick overview of the three core statements we’re about to dive into. Each one answers a very different, but equally important, question about your money.
The Three Key Financial Statements for Personal Finance
| Statement | What It Shows | Key Question It Answers |
|---|---|---|
| Balance Sheet | A snapshot of what you own (assets) vs. what you owe (liabilities) on a specific day. | As of today, what is my net financial position? |
| Income Statement | The flow of money over a period of time, tracking all your income and expenses. | Over the last month, did I earn more than I spent? |
| Cash Flow Statement | The actual movement of cash into and out of your accounts during a specific period. | Where did my money actually come from, and where did it go? |
By looking at all three, you move from just seeing numbers to understanding the story they tell.
The Balance Sheet: Your Financial Snapshot
The Balance Sheet is like a high-resolution photograph of your financial life, taken at a single, specific moment—say, the last day of the month. It’s a static view of everything you own (assets) versus everything you owe (liabilities). The all-important number that pops out when you subtract one from the other is your net worth.
It answers one simple but powerful question: As of right now, what’s my bottom line?
- Assets: This is all the good stuff. It includes cash in the bank, the current value of your investments, and the market value of physical property like your house or car.
- Liabilities: This side lists out all your debts. We’re talking mortgages, student loans, car payments, and any outstanding credit card balances.
An accurate balance sheet is the ultimate scorecard for your wealth-building journey. It’s the number that tells you if you’re actually moving forward.
The Income Statement: Your Financial Movie
If the balance sheet is a snapshot, the Income Statement is the movie. It shows the flow of your money over a defined period, like a month or a full year. In the business world, they call it a Profit & Loss (P&L) statement. For your personal finances, it’s a straightforward look at your income versus your expenses.
This statement gets to the heart of your daily habits, answering: Over the past month, did I earn more than I spent?
Your income statement details every dollar coming in—from your salary and side gigs to investment dividends. It then subtracts all your expenses, from fixed costs like rent to the variable stuff like groceries and going out, to reveal your net income (or, if it was a tough month, a net loss). This is ground zero for understanding your spending habits and finding opportunities to save more.
If you want to dig deeper into how this all comes together, check out our detailed guide on what a personal financial statement includes.
This is how you start connecting the dots. Understanding these reports brings clarity, which is the foundation for setting meaningful goals and actually tracking your progress.
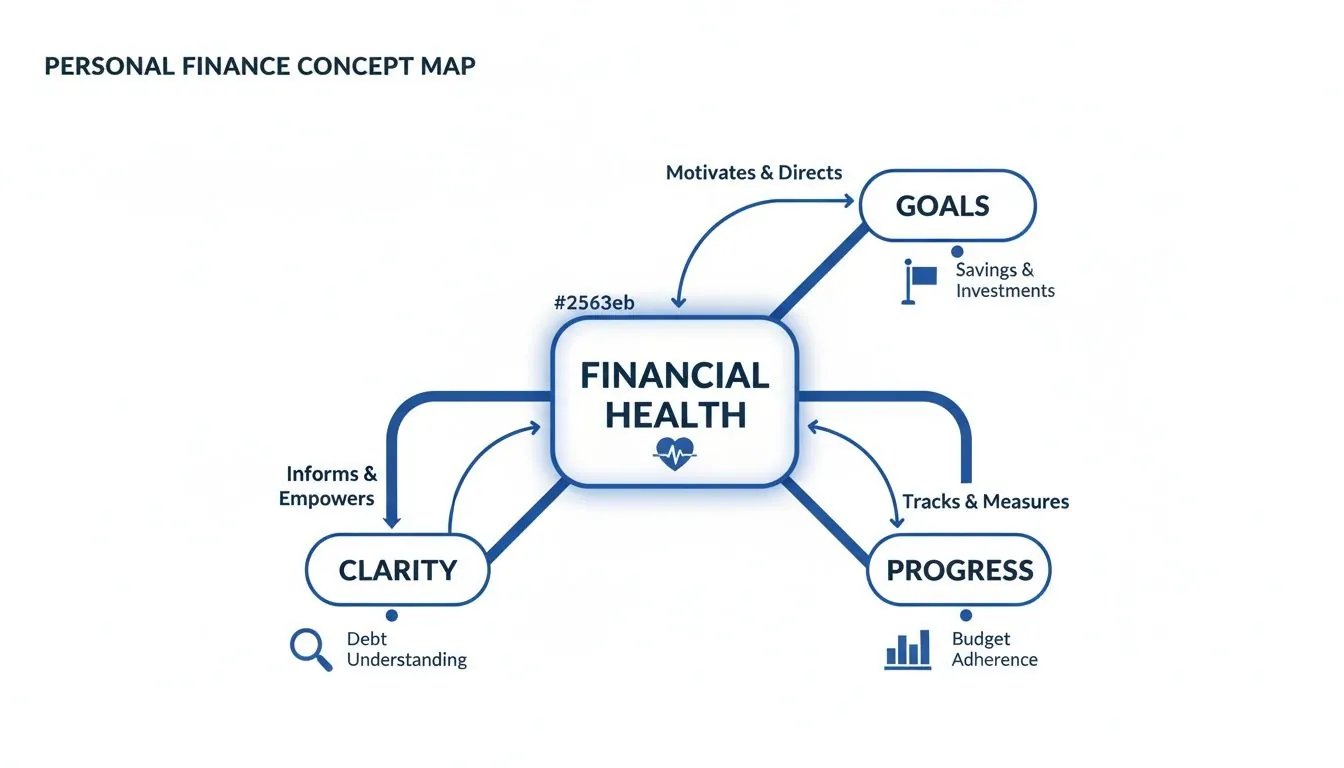
As the map shows, true financial health is built on a simple loop: setting goals, using reports to gain clarity, and measuring your progress.
The Cash Flow Statement: The Detective’s Report
Finally, we have the Cash Flow Statement. This one is the detective of the group. It meticulously tracks the actual movement of cash into and out of your accounts. While your income statement might show you earned a certain amount, the cash flow statement reveals how much of that cold, hard cash you actually have on hand.
It answers the most practical question of all: Where did my money actually come from, and where did it go?
This statement is a lifesaver because it solves common financial mysteries. Ever look at your bank account and wonder where all the money went, even with a good income? A cash flow statement would show you exactly where your cash was allocated—whether it was eaten up by debt payments, a few large purchases, or transferred into investment accounts. It connects the dots between what you earned and what you have left.
Key Ratios That Measure Your Financial Health
Think of your financial statements as raw ingredients. The real magic happens when you use those numbers to calculate key ratios—simple metrics that act like vital signs for your money. They cut through all the noise and tell you, in plain terms, whether you’re thriving, just getting by, or heading for trouble.
Instead of getting lost in formulas, think of these as direct answers to crucial questions about your financial life. This isn’t about memorizing accounting rules; it’s about using the numbers to make smarter decisions. These ratios are your shortcuts to powerful insights.
Your Savings Rate: The Engine of Wealth Creation
Your savings rate is arguably the most powerful indicator of your future wealth. It simply measures what percentage of your income you’re actually keeping after all your expenses are paid. A high savings rate is the fuel that powers your journey toward financial independence.
This metric answers a fundamental question: Am I building wealth fast enough to reach my goals?
Even a modest income can build significant wealth with a high savings rate, while a high income can be squandered with a low one. It’s a direct reflection of your financial discipline.
A healthy savings rate isn’t just about sacrifice; it’s about efficiency. It shows you’re consciously directing your money toward your future self, creating a gap between what you earn and what you spend that can be invested to grow.
Your Net Worth: The Ultimate Financial Scorecard
While your savings rate is the engine, your net worth is the ultimate scorecard. It’s the purest measure of your financial progress, calculated by subtracting your total liabilities from your total assets. This single number represents your entire financial position at one moment in time.
It answers the big-picture question: After everything is said and done, what is my financial value?
Tracking your net worth over time is like watching a financial movie of your life. It shows the cumulative effect of every financial decision you’ve ever made. Watching this number grow is one of the most motivating aspects of personal finance.
Key Ratios at a Glance
| Ratio | What It Measures | Why It Matters |
|---|---|---|
| Savings Rate | The percentage of income saved after expenses. | Determines the speed at which you build wealth. |
| Net Worth | Your total assets minus your total liabilities. | The ultimate measure of your financial progress over time. |
| Liquidity Ratio | Your ability to cover short-term expenses with cash. | Shows your resilience against unexpected financial shocks. |
Your Liquidity Ratio: The Financial Safety Net
Your liquidity ratio, sometimes called the current ratio, measures your ability to handle a financial emergency. It tells you how easily you could cover your immediate expenses using cash or assets that can be quickly converted to cash. Think of it as your financial first-aid kit.
This ratio answers a critical survival question: How prepared am I for an unexpected job loss or major expense?
A low liquidity ratio means you’re living on the edge, where a single unexpected bill could force you into debt. A strong ratio, on the other hand, provides peace of mind and the breathing room to navigate challenges without derailing your long-term goals. Another critical metric related to your financial stability is the debt-to-asset ratio. If you’re looking to understand this further, you might be interested in our guide on the debt-to-asset ratio calculation. This can give you a clearer picture of how much of your financial life is financed by debt.
Manually calculating these ratios can be tedious and prone to errors. This is where a tool like PopaDex becomes invaluable. It automates these calculations by syncing with your accounts, giving you an instant, real-time dashboard of these vital signs. You can see your net worth, track spending trends, and monitor your financial health without ever touching a spreadsheet.
How to Read Your Own Financial Reports Step by Step
Theory is one thing, but let’s get our hands dirty and make understanding financial reporting feel real.
We’ll do this by walking through a simple example. Meet Alex, a professional managing his finances across a couple of different countries. Alex makes a good living but has that nagging feeling—he’s not totally sure where his money is going or if he’s actually making progress toward his goals.
We’re going to look at simplified versions of Alex’s personal Balance Sheet and Income Statement. By putting these two reports together, we can uncover the kind of insights that transform raw numbers into a clear financial strategy. This is exactly how you can start interpreting your own figures.
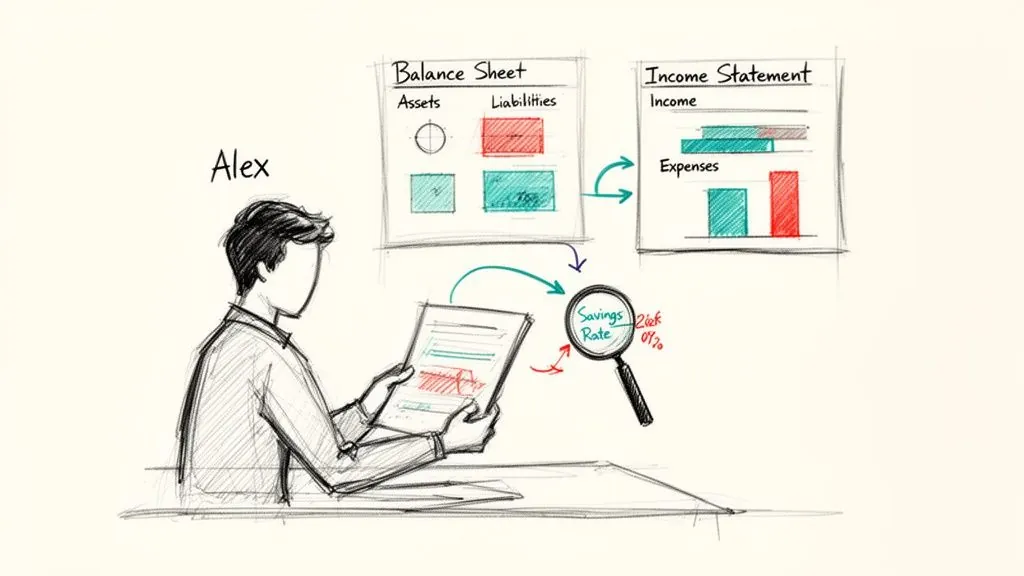
Step 1: Start With The Income Statement
First stop: Alex’s Income Statement for last month. Think of this report as the story of your cash flow over a set period—it shows what came in versus what went out. It’s the perfect place to begin because it immediately shines a light on spending habits and saving potential.
Here’s a quick look at Alex’s numbers:
- Total Monthly Income: $8,000
- Taxes: $2,000
- Housing (Rent & Utilities): $2,500
- Transportation: $500
- Food & Groceries: $800
- Personal Spending (Subscriptions, etc.): $1,200
- Debt Payments (Student Loan): $400
Once we tally up all his expenses ($7,400), we see Alex’s net income for the month is just $600. This is the cash left over to save, invest, or build wealth with.
The first insight hits you right away. Despite a strong income, his savings rate is only 7.5% ($600 / $8,000). That’s quite a bit lower than the 15-20% benchmark many financial experts recommend.
This one discovery is incredibly powerful. It changes the question from “How much do I make?” to “How much do I actually keep?” Alex now has a concrete number showing him that to build wealth faster, he needs to widen the gap between what he earns and what he spends.
Step 2: Move To The Balance Sheet
Next up is Alex’s Balance Sheet. This isn’t a story over time; it’s a snapshot of his complete financial picture on a single day—in this case, the last day of that same month. It lists out all his assets (what he owns) and liabilities (what he owes) to calculate his net worth.
What Alex Owns (Assets):
- Checking & Savings Accounts: $15,000
- Investment Portfolio: $180,000
- Car Value: $20,000
- Total Assets: $215,000
What Alex Owes (Liabilities):
- Student Loan Balance: $25,000
- Credit Card Debt: $5,000
- Total Liabilities: $30,000
By subtracting liabilities from assets, we get Alex’s current net worth: $185,000. That’s a solid foundation. But if we dig a little deeper, another critical insight emerges.
A massive 84% of Alex’s assets ($180,000 out of $215,000) are sitting in a single investment portfolio. This lack of diversification is a huge risk. If that one portfolio takes a nosedive, it could seriously damage his entire financial standing. If you’re looking for more ways to decode these numbers, it helps to learn how to analyze financial statements effectively.
Step 3: Connect The Dots And Take Action
The final step is where the magic happens. We connect these two insights to build an actual plan. The analysis flagged two clear issues: a low savings rate and highly concentrated assets. This is where financial reporting stops being about numbers and starts being a roadmap.
With this clarity, Alex can set a couple of clear, measurable goals:
- Boost His Savings Rate: He can zoom in on that “Personal Spending” category from his income statement to find places to cut back. The goal? Push his monthly savings from $600 up to $1,200, which would get him to a much healthier 15% rate.
- Diversify His Assets: He can now create a strategy to reallocate some funds from that main investment portfolio into other asset classes, like real estate or different types of bonds, to spread out the risk.
This simple, three-step process is what moves you from just looking at numbers to truly understanding financial reporting.
With a tool like PopaDex, Alex can automate the tracking of these statements, watch his savings rate in real-time, and see exactly how his diversification efforts are impacting his overall net worth. The reports are no longer just static data; they become dynamic tools for building a more secure financial future.
How Global Financial Trends Affect Your Bottom Line
Your personal finances don’t exist in a vacuum. In our connected world, big economic currents—from shifting currency values to the plumbing of international payment systems—can ripple right down to your personal bottom line. Getting a handle on this bigger picture is a must for anyone serious about understanding financial reporting for their own wealth.
This is especially true if you’re an expat, digital nomad, or anyone managing assets across multiple countries. The moment your money crosses a border, it steps into a complex web of different banking rules, reporting standards, and economic policies. What happens in one country can easily swing the value of assets you hold in another.
The Borderless Challenge of Financial Tracking
Managing finances internationally brings a unique set of headaches that go way beyond simple budgeting. Suddenly, you’re grappling with fluctuating exchange rates that can eat into your savings or juice your investment returns overnight. You’re also up against different tax laws and transaction fees that muddy the waters of your financial picture.
This makes getting a single, unified view of your net worth a massive challenge. It’s no longer just a matter of adding up your assets; it’s about translating their value across different systems and currencies to see the true, consolidated total.
A consolidated view is no longer a luxury but a necessity for modern financial management. Without it, you are making decisions based on an incomplete and fragmented picture of your own wealth.
The Global Payments Maze
Underpinning all of this is the massive global payments infrastructure. Think of it as the circulatory system of the world’s economy—and its complexity has a direct impact on your personal financial reporting. This network handles a mind-boggling volume of transactions, generating $2.5 trillion in revenue from $2.0 quadrillion in value flows. You can dive deeper into this vast financial network in the McKinsey Global Payments Report. For anyone managing money across borders, this system dictates how fast your funds move and how your data gets reported between banks.
As businesses expand globally, the need for accurate financial document translation services becomes critical to navigate international markets and comply with regulations. The same logic applies to individuals who need to make sense of reports from foreign banks or investment firms.
A Unified Solution for a Global Life
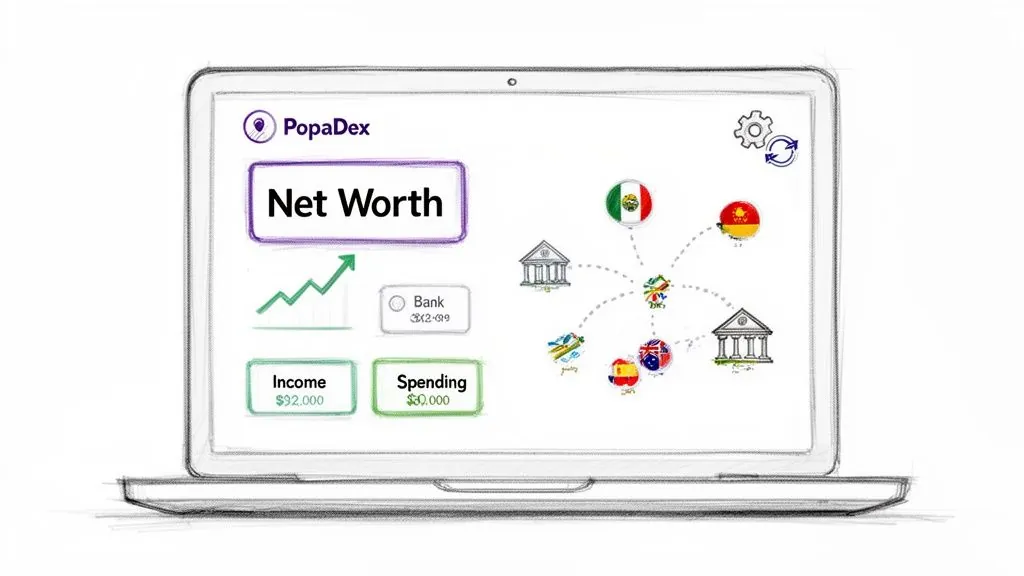
This is exactly where the right tools become indispensable. A platform like PopaDex was built specifically for this borderless reality. By syncing with over 15,000 banks in 30+ countries, it slices through the complexity of international finance.
It automatically handles the tasks that would be a nightmare to manage by hand:
- Currency Conversion: It translates all your assets into your primary currency, giving you a real-time, accurate measure of your total net worth.
- Data Consolidation: It pulls data from all your different financial institutions into one clean dashboard, so you can stop logging into a dozen different accounts.
- Standardized Reporting: It presents your global assets and liabilities in a consistent format, making it easy to see your complete financial position at a glance.
By automating this process, you get a clear, reliable, and up-to-date view of your financial health, no matter where in the world your money happens to be.
Automate Your Financial Reporting with PopaDex
Let’s be honest: manually wrestling with balance sheets and income statements in a spreadsheet is a painful, outdated ritual. The real power today isn’t just in having the numbers, but in turning raw data into instant, actionable insights—without the mind-numbing busywork. Think of automation as your personal financial analyst, working 24/7 in the background.
This is exactly where PopaDex comes in. It pulls together every single asset and liability you have—from savings accounts and investment portfolios to your mortgage and that pesky student loan—into one dynamic, easy-to-read dashboard. This isn’t a static report you have to manually update every month; it’s a living, breathing view of your financial health.
Ultimately, this automation gives you back your most valuable resource: your time. Instead of spending hours digging up statements and fumbling with formulas, you get an immediate, holistic picture of your finances.
The Power of Automated Insights
With a platform like PopaDex, your financial statements finally come to life. Your balance sheet stops being a boring list of what you own and owe and transforms into a real-time net worth tracker that moves with every market swing and transaction. Your income statement goes from a monthly chore to a clear, visual story of where your money is going.
This approach gives you a few massive advantages:
- Eliminates Human Error: Let’s face it, manual data entry is a recipe for typos and mistakes that can throw off your entire financial picture. Automation guarantees accuracy by pulling data straight from the source.
- Provides Instant Clarity: Interactive dashboards show you trends in your income, spending, and net worth, giving you a powerful “financial movie” of your progress.
- Empowers Confident Decisions: With up-to-the-minute data, you can make smarter choices about saving, investing, and spending, knowing your numbers are solid.
The real win with automation is shifting your energy from data collection to decision-making. It frees you from the grunt work of tracking your money so you can focus on making it grow.
Built for a Connected Financial World
This kind of integration is more critical than ever, especially for anyone with a global footprint. As digital banking explodes worldwide, it’s becoming easier to connect your accounts. The World Bank’s Global Findex Database shows that 40% of adults in developing economies now use a financial account to save—a huge jump since 2021. You can dive deeper into the global financial inclusion data on WorldBank.org.
For expats and international professionals, this trend means more of your banks can “talk” to a central platform.
PopaDex was built for this interconnected reality. By syncing with thousands of institutions, it effortlessly pulls all your financial puzzle pieces together into one place. This lets you stop juggling fragmented accounts and start managing a single, unified financial strategy. If you’re ready to see this in action, you can learn more about how to automate financial reporting with PopaDex.
Common Questions Answered
As you start putting these financial reporting ideas into practice for your own net worth, some questions are bound to come up. Let’s tackle the most common ones head-on.
How often should I actually be checking this stuff?
Think of it in two layers: strategy and tactics.
For big-picture planning, a quarterly review is perfect. This is when you zoom out, see how your net worth is trending over the last three months, and confirm your long-term investment plan still makes sense. It’s your chance to see the forest for the trees.
But for the day-to-day, a monthly check-in is essential. This is more tactical. It helps you catch spending leaks, make sure you’re hitting your savings targets, and stay on top of your budget.
The real magic happens when you combine both. Use your monthly check-ins to steer the ship day-to-day, and the quarterly reviews to make sure you’re still sailing toward the right island. A dashboard like PopaDex gives you that instant clarity whenever you need it, bridging the gap between the two.
What’s the single most important number for building wealth?
While Net Worth is the ultimate scoreboard—it tells you the final result of your financial habits—it’s what’s known as a lagging indicator. It shows you where you’ve been, not necessarily where you’re going.
If you want to actively build wealth, you need to focus on a leading indicator, something that pulls your net worth up. That number is your Savings Rate.
Your savings rate is the engine of wealth creation. It directly controls how quickly you can pile up cash to invest. A high savings rate has a more immediate and powerful effect on your financial future than just about anything else you can control. It’s the one lever you can pull every single day.
Can’t I just use a spreadsheet for this?
Absolutely. A spreadsheet is a great first step. It forces you to get organized and understand the basic mechanics of assets and liabilities. But as your financial life gets even a little bit more complex, you’ll feel the limitations pretty quickly.
Here’s where spreadsheets tend to fall apart:
- They’re full of tiny landmines. One typo in a formula or a misplaced decimal point can throw your entire net worth calculation off, leading you to make bad decisions based on bad data.
- They’re instantly out of date. A spreadsheet is only as current as the last time you painstakingly updated it. It can’t show you how the market moved your portfolio today or account for that purchase you just made.
- They’re not great storytellers. Good luck getting a spreadsheet to create the kind of dynamic, interactive charts that let you spot trends in your spending, income, or net worth at a glance.
A spreadsheet is better than nothing, sure. But it’s like using a paper map in the age of Google Maps. An automated platform gives you the accuracy, real-time data, and clarity you need to navigate with confidence.
Ready to stop wrestling with spreadsheets and get a crystal-clear, automated view of your entire financial world? PopaDex consolidates your global assets into one simple, powerful dashboard. Start your free trial today and take control of your net worth.