Our Marketing Team at PopaDex
What Is the Average Rate of Return Stock Market?
You’ve probably heard the number before: the U.S. stock market has delivered an average annual return of around 10% over the long haul. This figure is a cornerstone for investors setting financial goals, but it’s crucial to understand what it really means—and what it doesn’t. Think of it as a benchmark, not a guarantee.
What Investors Really Mean by Average Stock Market Return

When investors talk about the “average rate of return,” they’re looking for a reliable baseline to plan for the future. It’s a lot like knowing the average temperature of a city. While the yearly average gives you a good idea of what to pack, any single day—or in this case, any single year in the market—can be much hotter or colder.
This benchmark is fundamental for long-term financial planning. It helps you tune out the noise of daily market swings and focus on what truly matters: your goals, whether that’s saving for retirement or a down payment on a home.
Historical Benchmarks: A Starting Point, Not a Crystal Ball
To set realistic expectations, we look at historical data. While past performance is never a guarantee of future results, it gives us a powerful glimpse into the market’s behavior across all kinds of economic cycles. The S&P 500 index, which tracks 500 of the largest U.S. companies, is the most common yardstick for this.
The average stock market return is a powerful tool for planning, not a promise for any single year. It represents the smoothed-out performance over decades of booms and busts, highlighting the long-term upward trend of the market.
This long-term perspective is everything. Over the past 150 years, the S&P 500 has delivered an average annual return of roughly 9.35%, assuming dividends were reinvested. But here’s the interesting part: that average changes depending on the timeframe you look at.
To see this in action, here’s a quick look at how the average stock market return changes depending on the time period measured.
Historical S&P 500 Average Annual Returns (Nominal)
| Time Period | Average Annual Return | | :— | :— | | Last 150 Years | ~9.35% | | Last 100 Years | ~10.46% | | Last 10 Years | ~12.57% |
Source: tradethatswing.com, assuming dividend reinvestment.
As you can see, the time slice matters. The last decade has been unusually strong, while the 150-year figure includes everything from the Great Depression to the dot-com bubble.
Understanding these figures helps you build a more realistic financial roadmap. By using a long-term average, you can make informed projections for your own goals without getting thrown off course by the market’s inevitable short-term drama.
How Market Returns Are Actually Calculated
When you hear someone toss around the “average” stock market return, you probably assume it’s a straightforward calculation. But it’s not. The method used can paint two very different pictures of an investment’s performance.
Getting a handle on the two main ways returns are measured is the first step toward setting expectations that are grounded in reality, not hype.
The first method is the one we all remember from math class: the arithmetic mean, or just a simple average. You simply add up the returns for each year and divide by the number of years. It’s easy, sure, but it has a massive blind spot—it completely ignores the powerful effect of compounding.
This is exactly why most finance pros use a different, more telling metric.
The True Story Teller: Geometric Mean (CAGR)
The second, and far more accurate, method is the geometric mean. You’ll almost always see it referred to as the Compound Annual Growth Rate (CAGR).
Think of CAGR like measuring the growth of a plant over several years. One year it might shoot up during a sunny season, and the next it might barely grow at all during a drought. CAGR smooths out all those peaks and valleys to tell you the single, steady growth rate it would have needed each year to get from its starting height to its final height.
When you’re digging into how your investments are performing, understanding how different rates of return are determined is critical. CAGR gives you the real story because it accounts for the reality of compounding. Your gains from one year become the new starting point for the next, and losses shrink the base you have to grow from.
The arithmetic mean tells you what you might have earned on average in any given year. The geometric mean (CAGR) tells you what you actually earned over your entire investment period, smoothed out into an annual number.
A quick example makes the difference crystal clear.
A Tale of Two Averages
Let’s say you invest $1,000.
- Year 1: The market is hot, and your investment jumps 20%. You now have $1,200.
- Year 2: The market cools, and your investment drops 10%. That 10% loss is calculated on your new, higher balance of $1,200, meaning you lose $120. You end the year with $1,080.
So, what was your “average” return?
- Arithmetic Mean: (20% + (-10%)) / 2 years = 5% per year.
- Geometric Mean (CAGR): Your actual growth from $1,000 to $1,080 over two years works out to a CAGR of about 3.92% per year.
See the gap? The simple average is misleadingly high. It suggests you earned 5% a year, but the real-world growth of your money was closer to 3.92% annually. This difference might seem small, but over decades of investing, it becomes a massive chasm.
For any kind of long-term planning, CAGR is the number that matters. It’s the one that reflects how your money actually grew, and it’s the best figure to use when projecting your financial future. You can dive deeper into how to calculate rate of return for your own portfolio to get a true picture of your progress.
Navigating Market History and Performance
While the stock market’s long-term average return might paint a picture of steady growth, the journey itself is rarely a straight line. Market history is a gripping story of epic highs and gut-wrenching lows, all driven by economic cycles, new technologies, and global events. If you want to succeed as a long-term investor, understanding this history is more than helpful—it’s essential for building resilience.
Think of the market’s path like hiking up a mountain. The overall trend is upward, but you’ll hit plenty of dips, switchbacks, and steep climbs along the way. If you fixate on the rough patches, you might be tempted to turn back and miss the breathtaking view from the summit.
Using the S&P 500 as our guide, we can see this exact pattern play out over decades. The long-term trend is undeniably positive, but it’s punctuated by periods of intense volatility.
The Rhythms of Bull and Bear Markets
The market moves in cycles, switching between periods of growth (bull markets) and decline (bear markets). These aren’t glitches; they’re a natural part of the economic landscape. Major events have always shaped these cycles, creating both turbulence and opportunity for investors who stay the course.
- The Dot-Com Boom (Late 1990s): A period of explosive growth fueled by the new internet economy, followed by a brutal correction when the speculative bubble burst.
- The 2008 Financial Crisis: A severe global recession triggered by the housing market collapse, which led to one of the sharpest downturns in modern history.
- The Post-Crisis Recovery (2009-2020): One of the longest bull markets on record, proving the market’s powerful ability to rebound.
- The COVID-19 Pandemic (2020): A sudden, shocking crash followed by an equally stunningly quick recovery, driven by unprecedented government stimulus and massive shifts in how we live and work.
Each of these events felt like the end of the world at the time. Yet, the market eventually absorbed the shock and continued its upward march. This history is vital because it teaches us that volatility is a feature of investing, not a bug.
A Century of Stock Market Returns
The numbers back up this story of long-term growth hiding within short-term chaos. The S&P 500, a reliable stand-in for the broader market, tells a very clear tale.
Since its modern inception, the S&P 500 has weathered countless storms. For instance, historical data shows that since 1928, the index has delivered an average annual return of about 8.55%, dividends included.
More recently, the average annual return for the stock market’s past 10 years (2014-2024) has been even stronger at approximately 11.01%, a reflection of a powerful bull run. However, longer timeframes like the 30-year average bring that number to a more moderate 9.33%, smoothing out the recent highs. You can find more insights on these historical return trends over at Carry.com.
The key takeaway from market history is perspective. By understanding that downturns are temporary and growth is the long-term norm, investors can avoid making fear-based decisions and stick to their financial plans.
By zooming out and looking at the market’s performance over decades, not days, you can build the conviction needed to ride out the inevitable storms. This long-term view turns market noise into historical context, empowering you to focus on your goals instead of reacting to every headline.
Understanding the True Power of Your Money
The numbers on your investment statement can be deceiving. Seeing your portfolio jump 10% in a year feels fantastic, but that figure alone doesn’t tell the whole story.
To really get a grip on your financial progress, you have to look beyond the screen and ask a more important question: what can my money actually buy?
Think of it like getting a 5% raise at work. On paper, you’re earning more. But if groceries, gas, and rent went up by 3% that same year, your real bump in purchasing power is just 2%. This simple idea is the key to unlocking one of the most critical concepts in investing.
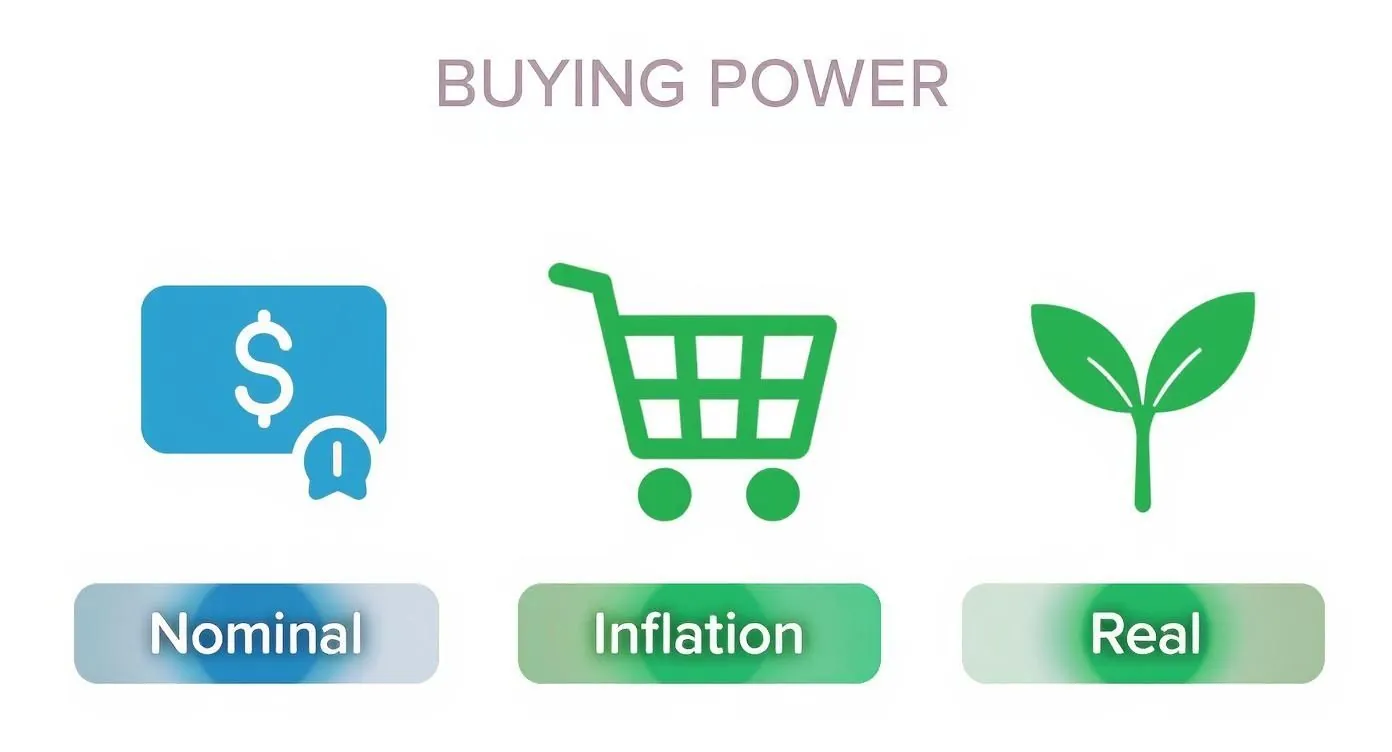
Nominal Returns vs. Real Returns
Every investor needs to get comfortable with these two terms. They’re the lens you need to see the genuine growth of your wealth.
Nominal Return is the raw, unadjusted percentage you see on your statement. Real Return is what’s left after you subtract the rate of inflation, showing your true gain in purchasing power.
This is more than academic—it has a massive impact on your long-term financial planning. You often hear that the historical average nominal return for the stock market is around 10%. But when we account for historical inflation, which hovers around 3%, the picture changes completely.
Suddenly, that impressive 10% becomes a more realistic 7% real return. This is the number that truly matters for your retirement goals, as it reflects how much your wealth is actually growing after the rising cost of living takes its bite. Grasping the future value of money is essential to see how inflation quietly erodes your savings over time.
History backs this up. Adjusted for inflation, the 150-year average return for U.S. stocks is about 6.94%. While the recent 5-year average nominal return was a stellar 16.43%, its real return was a lower 11.33% after inflation. This shows just how crucial it is to keep your eye on real returns.
To really maximize the power of your money over the long haul, looking into different models for 401k asset allocation by age can be a game-changer, as it shows how strategic shifts impact long-term growth. The ultimate goal goes beyond growing your account balance—it’s to grow your real-world wealth.
Why Your Time Horizon Is Your Greatest Advantage
The average rate of return for the stock market is a powerful concept, but it’s not the whole story. To really make it work for you, you need its secret weapon: time.
Your time horizon—how long you plan to stay invested—is probably the single greatest tool you have for managing risk and capturing the market’s long-term growth.
History shows a clear and powerful relationship here. The longer you stay in the game, the narrower the range of possible outcomes becomes, and the lower your chances of actually losing money. Think of it like a turbulent river. If you only dip your toe in for a second (a short time horizon), you might get hit by a sudden, jarring wave. But if you float along for miles (a long time horizon), the twists and turns smooth out, and the current carries you steadily forward.
This is why your initial investment needs time to overcome the bite of inflation and achieve real, tangible growth in buying power.
Taming Volatility with Patience
Let’s be honest: short-term market movements are completely unpredictable. In any single year, returns can swing wildly. The S&P 500 might soar by +20% one year and then plummet by -15% the next. This kind of volatility is nerve-wracking if you’re glued to your portfolio day in and day out.
But something amazing happens when you zoom out and look at 10, 15, or 20-year periods. A remarkable pattern emerges. The extreme highs and lows start to cancel each other out, and the range of average annual returns tightens up considerably. The likelihood of ending up with a negative return drops like a rock the longer you stay invested. That’s the magic of compounding in action, with time acting as the ultimate antidote to volatility.
Over rolling 10-year periods since 1926, the S&P 500 has produced a positive return approximately 95% of the time. For 20-year periods, that figure climbs to 100%. Time truly is the investor’s best defense against market downturns.
This is exactly why thinking in decades, not days, is the cornerstone of building sustainable wealth. You can learn more about spotting opportunities in our guide on the best time to invest.
Why the “Average” Is Rarely the Reality in a Single Year
Here’s a crucial reality check: the market almost never delivers its “average” return in any given year.
An analysis of the S&P 500’s annual returns from 1926 through 2018 is pretty eye-opening. It shows that returns were all over the map, straying far from the long-term 10% average. In fact, only 6 out of those 93 years actually saw returns land within a narrow band of 8% to 12%.
This data just reinforces the value of patience. An investor with a long-term view can confidently ride out the turbulence, knowing that history is on the side of those who stay the course and let the long-term averages do their work.
Putting Average Returns to Work for Your Goals
So, you understand the historical average rate of return for the stock market. That’s a great start. But the real magic happens when you connect those numbers to your actual life goals. This is where theory gets put to the test and abstract percentages start funding your future.
Let’s talk about the big one: retirement. Imagine you’re 30 and trying to figure out what your investments might look like decades from now. It’s tempting to plug in that flashy 10% average return we often hear about. But a smarter move is to use a more grounded 7% real return, which already has inflation baked out of it.
This small shift in thinking gives you a far more realistic picture of what your money will actually be able to buy when you retire. It’s the difference between a plan and a daydream.
Projecting for Different Life Goals
This same logic applies to any long-term financial goal you have. The trick is to match your expectations to your timeline. A shorter runway means you have less time to bounce back from market dips, so dialing down your expected return is just plain smart.
Here’s a practical way to think about it:
- Retirement (20+ years away): Planning with a 6-7% real return is a solid, reasonable baseline. With decades ahead, you have plenty of time for compounding to smooth out the bumps and do its heavy lifting.
- Buying a Home (5-10 years away): For a medium-term goal like this, you might lower your expectations to a 4-5% return. This builds in a buffer in case you need to pull your money out during a down cycle.
- Major Purchase (1-3 years away): Goals this close are extremely vulnerable to market swings. For money you need soon, it’s often safest to plan for minimal or even zero growth from your stock investments.
Your time horizon is your strategy guide. The further out your goal, the more you can lean on long-term averages to ride out the market’s storms and truly cash in on compound growth.
To really see what this means, let’s look at how a $10,000 investment can blossom over time.
The table below shows the incredible impact of compounding. Notice how tiny differences in the average annual return can lead to massive gaps in your final account balance over the long haul.
The Power of Compounding Over Time
| Time Horizon | Growth at 5% Avg Return | Growth at 7% Avg Return | Growth at 9% Avg Return |
|---|---|---|---|
| 10 Years | $16,289 | $19,672 | $23,674 |
| 20 Years | $26,533 | $38,697 | $56,044 |
| 30 Years | $43,219 | $76,123 | $132,677 |
The takeaway here is crystal clear. Consistent investing, paired with a realistic grasp of average returns, is the bedrock of any successful financial plan. And when you use a tool like PopaDex, you can track these goals in real-time, giving you the power to see your progress and make smart adjustments along the way.
A Few Common Questions About Stock Market Returns
When you’re getting started, a few questions pop up time and time again. Let’s tackle some of the most common ones to clear things up and help you invest with more confidence.
Can I Expect a 10% Return Every Single Year?
Nope, and it’s so important to understand why this is a myth. That 10% figure you hear about is a long-term historical average, not some kind of annual guarantee from Wall Street.
In the real world, returns are all over the place. One year, the market might soar +20% or more. The next, it could dip into negative territory. The “average” just smooths out all those wild peaks and valleys over many, many decades.
Is It Too Late for Me to Start Investing?
History has a pretty clear answer on this one: the best time to invest was yesterday. The next best time is right now. Time is your single greatest ally, thanks to the incredible power of compounding.
Even small amounts invested today can balloon into something substantial given enough time to grow.
The real secret isn’t about timing the market perfectly—it’s about spending time in the market. Consistently putting your money to work is the most reliable path to building wealth over the long haul.
What’s a Realistic Rate of Return for My Financial Plan?
While history points to a nominal average near 10%, for practical, real-world planning, it’s smarter to be a bit more conservative. A 6-7% real return is a much more grounded figure to use.
Why? Because that number already accounts for the historical bite of inflation. Using a real return gives you a much better sense of your future purchasing power and helps you set financial goals that are actually achievable. It’s the kind of solid foundation every good long-term strategy is built on.
Ready to stop guessing and start planning? Bring your entire financial picture into focus with PopaDex. Track your investments, monitor your net worth, and plan for your future with clarity and confidence. Start your free trial at PopaDex.com today.