Our Marketing Team at PopaDex
Calculating Rental Income for Your Investment Property

Calculating rental income isn’t just about seeing rent checks hit your bank account. It’s about digging deeper to find the real profit left over after all your expenses are paid. This means subtracting all your operating costs from your gross income to get a true picture of your property’s financial health and, most importantly, its cash flow.
Why Getting Your Rental Income Math Right is a Game-Changer
Before you can even think about turning a profit in real estate, you need an honest look at your financials. This goes beyond tallying up the monthly rent; it’s about mastering the numbers that make or break your investment. An accurate grasp of these figures is what separates landlords who thrive from those who are just treading water.
Think of it as the bedrock of your entire investment strategy. Nail this from day one, and you’ll make smarter decisions at every turn.
It’s More Than Just Collecting Rent
At its heart, calculating rental income is about understanding the massive difference between the gross rent you collect and the net income that actually lands in your pocket. This distinction is everything. A property pulling in high rent might look amazing on paper, but if it’s saddled with high expenses, those gains can vanish in a flash, leaving you with little to no positive cash flow.
When you master these calculations, you can:
- Compare properties apples-to-apples: Use standardized metrics to objectively weigh different investment opportunities.
- Secure financing with confidence: Lenders need to see detailed, realistic income projections before they’ll even consider approving a loan.
- Accurately forecast your returns: Get a real sense of your potential cash flow and return on investment (ROI).
- Sidestep nasty surprises: By accounting for every possible expense upfront, you can avoid those unexpected shortfalls that sink new investors.
I’ve seen it happen time and again: a new investor gets excited about the mortgage payment being covered by rent but completely underestimates the “slow leaks.” Things like vacancy, repairs, and property management fees can absolutely cripple an otherwise solid investment.
A Look at the Bigger Picture
For any investor serious about maximizing returns, these calculations are non-negotiable. To put it in perspective, the average gross rental yield in the United States—that’s the annual rent collected as a percentage of the property’s value—hit 6.51% in Q3 2025. That’s up from 6.10% the year before.
But that “average” can be misleading. Yields swing wildly depending on where you are. Markets like Atlanta might see yields around 8%, while pricey cities like Seattle hover closer to 4.56% because of their sky-high property values. You can dive deeper into these rental yield trends on Global Property Guide.
This guide is designed to get you past the guesswork. By the end, you’ll have a clear, unfiltered view of your property’s financial reality, starting with the core metrics every successful real estate investor has on lockdown.
Figuring Out Your Gross and Effective Income
Before we get into the nitty-gritty of cash flow and expenses, we need to set the foundation. The first step is figuring out what your property could earn versus what it realistically will earn. There’s a world of difference between those two numbers.
Getting these top-line figures right is non-negotiable. If you start with shaky income projections, every other calculation you make will be built on that same unstable ground. We’ll begin with the best-case scenario and then bring things back down to earth.

What Is Gross Potential Income
First up is your Gross Potential Income (GPI). Think of this as the absolute ceiling—the maximum amount of rent you could possibly collect if everything went perfectly. We’re talking 100% occupancy, every single day of the year, with every tenant paying their rent on time, in full. It’s an ideal-world number, but a necessary starting point.
The calculation is straightforward: just multiply the monthly market rent by 12.
Let’s say you own a duplex. After checking out comparable units in the area, you’ve landed on a fair market rent of $1,600 per month for each unit.
- Monthly GPI: $1,600/unit x 2 units = $3,200
- Annual GPI: $3,200/month x 12 months = $38,400
So, $38,400 is your property’s maximum earning potential. But as any seasoned landlord knows, hitting that number is next to impossible. Life happens. That’s where our next calculation comes in.
Adjusting for Vacancy and Credit Loss
Time for a reality check. The Effective Gross Income (EGI) takes your GPI and subtracts an allowance for Vacancy and Credit Loss. This is the financial buffer that accounts for those inevitable empty periods between tenants or, in tougher situations, when a tenant doesn’t pay their rent.
A common practice is to estimate a vacancy rate as a percentage. This number can swing wildly depending on your local market, the condition of your property, and how well you screen tenants. A hot market might only see a 3-5% vacancy rate, while a slower area could easily hit 8-10% or more. My advice? Always lean conservative with this estimate.
For our duplex example, we’ll use a 5% vacancy and credit loss rate.
Key Insight: Never assume a 0% vacancy rate, even in a strong market. Tenant turnover, unexpected repairs between leases, and life events can all lead to empty units. Building this buffer into your calculations from the start prevents major financial surprises.
To get the dollar amount for this loss, just multiply your GPI by the vacancy rate.
- Annual Vacancy Loss: $38,400 (GPI) x 5% = $1,920
Now we can calculate your Effective Gross Income, a much more reliable number for your financial planning.
EGI = Gross Potential Income - Vacancy and Credit Loss
For our duplex:
- EGI: $38,400 - $1,920 = $36,480
This $36,480 is the adjusted, realistic income you can actually expect to see hit your bank account over the year. It’s the real starting point for subtracting your operating expenses, which we’ll tackle next.
How Other Income Factors In
Sometimes, the rent check isn’t the only money your property brings in. You might have other small income streams that need to be accounted for. Adding these to your EGI gives you the most complete picture of your total revenue before costs.
Common sources of “other income” include things like:
- Late Fees: For when tenants miss their rent due date.
- Pet Fees: Either a one-time charge or a monthly fee for furry tenants.
- Laundry Services: Revenue from coin-op machines in a common area.
- Parking or Storage Fees: Charging extra for a dedicated spot or a storage unit.
If our duplex had a shared laundry room that brings in about $50 a month ($600 a year), we’d add that right onto our EGI. This simple step makes our income projection that much more accurate and solidifies the foundation for calculating your all-important net income.
Uncovering All Your Operating Expenses
Getting a handle on your Effective Gross Income is a great first step, but it’s only half the story. The real secret to understanding your rental’s profitability is mastering the other side of the ledger: your expenses.
This is exactly where so many new investors trip up. They get laser-focused on the mortgage payment but completely miss the dozens of smaller costs that silently chip away at their bottom line. To get ahead, you have to think beyond the obvious. A truly comprehensive expense list is the bedrock of an accurate net income calculation—it’s what saves you from ugly financial surprises down the road.
Beyond the Obvious Mortgage Payment
Your monthly mortgage payment might be the single biggest check you write, but it’s just the tip of the iceberg. True operating expenses cover every single cost needed to keep the property running, rented, and in decent shape, excluding your loan principal. Let’s break down what you absolutely have to account for.
First up are the fixed costs, the ones that don’t change much month to month:
- Property Taxes: Usually paid once or twice a year, but you need to budget for them monthly. No exceptions.
- Insurance: A landlord or hazard insurance policy isn’t optional. It’s essential protection for your asset.
- HOA Fees: If your rental is in a planned community, these monthly or quarterly dues are a mandatory line item.
Then come the variable costs, which can swing based on usage, the season, or just plain bad luck. These are the ones that catch people off guard.
- Utilities: Even if your tenants cover electricity and gas, you might still be on the hook for water, sewer, or trash collection.
- Routine Maintenance: This is your “wear and tear” fund. Think leaky faucets, running toilets, or patching up some drywall. Small stuff adds up.
- Property Management Fees: Hiring a pro? Expect to pay 8-12% of the collected monthly rent. It’s a significant cost you can’t afford to ignore.
Investor Tip: Don’t try to pinch pennies by self-managing unless you’re truly prepared for the hands-on work. The time and stress a good property manager saves often far outweighs the fee, especially if you don’t live near your rental.
Planning for Major Future Repairs
Now for the category that can absolutely sink an unprepared investor: Capital Expenditures, or CapEx. These aren’t your everyday fixes. We’re talking about the big, infrequent, and painfully expensive replacements of major systems. A new roof. A full HVAC replacement. A new water heater.
Because these bills don’t show up every month, it’s dangerously easy to forget about them. But failing to build a CapEx fund is a recipe for disaster. When that $10,000 roof replacement comes due, you need to have the cash ready. A solid rule of thumb is to set aside 5-10% of your monthly gross rent specifically for future CapEx.
Forecasting these big-ticket items has become even more critical lately. From 2023 through 2025, we’ve seen a sharp spike in rental prices worldwide, largely because construction materials, labor, and borrowing costs have all gone up. For instance, U.S. renters saw an 18% jump in rent since January 2023, driven by inflation and interest rate hikes hitting landlords’ costs. This economic squeeze makes disciplined budgeting for CapEx more important than ever. You can read what to expect through 2025 on Nasdaq.com to get a better sense of how global trends are impacting property owners.
Putting It All Together with a Real-World Example
Let’s circle back to our duplex example, which we calculated has an Effective Gross Income of $3,040 per month ($36,480 annually). Now, let’s build out a realistic monthly expense sheet.
| Expense Category | Estimated Monthly Cost | Notes |
|---|---|---|
| Property Taxes | $300 | Based on an annual bill of $3,600 |
| Landlord Insurance | $100 | Standard hazard insurance policy |
| Maintenance & Repairs | $152 | Budgeting 5% of monthly EGI for small fixes |
| Capital Expenditures | $228 | Setting aside 7.5% of EGI for big-ticket items |
| Vacancy (Already Accounted) | $160 | Our 5% buffer, already removed from GPI |
| Property Management | $243 | Assuming an 8% fee on collected rent |
| Landscaping | $75 | Basic lawn care for the property |
| Total Monthly Expenses | $1,098 |
See how quickly those costs pile up? That initial $3,040 in effective income is suddenly knocked down by $1,098 in operating expenses—and that’s before we’ve even touched the mortgage. This process is absolutely essential. Manually keeping track of all this can be a real headache, which is why a solid system is key. For a deeper dive, check out our guide on how to track expenses for your rental property.
A Quick Estimation Tool: The 50 Percent Rule
When you’re first looking at a potential deal and don’t have time to itemize every last expense, there’s a handy shortcut you can use called the 50% Rule.
This rule of thumb suggests that, on average, your total operating expenses (everything except the mortgage) will be about 50% of your gross income. It’s an aggressive estimate that bakes in assumptions for maintenance, CapEx, management, taxes, insurance, and vacancy.
For our duplex with a Gross Potential Income of $3,200 per month:
- Estimated Expenses: $3,200 x 50% = $1,600 per month
This back-of-the-napkin math tells you that after all operating costs are paid, you should have around $1,600 left to cover your mortgage. Anything left over is your cash flow. It’s no substitute for a detailed analysis, but it’s a powerful way to quickly weed out properties that clearly aren’t going to work.
Calculating Your Net Operating Income and Cash Flow
Alright, you’ve tallied up your income and wrangled all those operating expenses. Now it’s time to put it all together. This is where the rubber meets the road, and we figure out the two numbers that really matter to any landlord: Net Operating Income (NOI) and Cash Flow.
Think of NOI as a property’s pure, unfiltered earning power—what it makes before the mortgage is even considered. Cash flow, on the other hand, is the bottom line. It’s the cash that actually hits your bank account each month after everyone else gets paid.
This infographic breaks down where all that rental income goes.
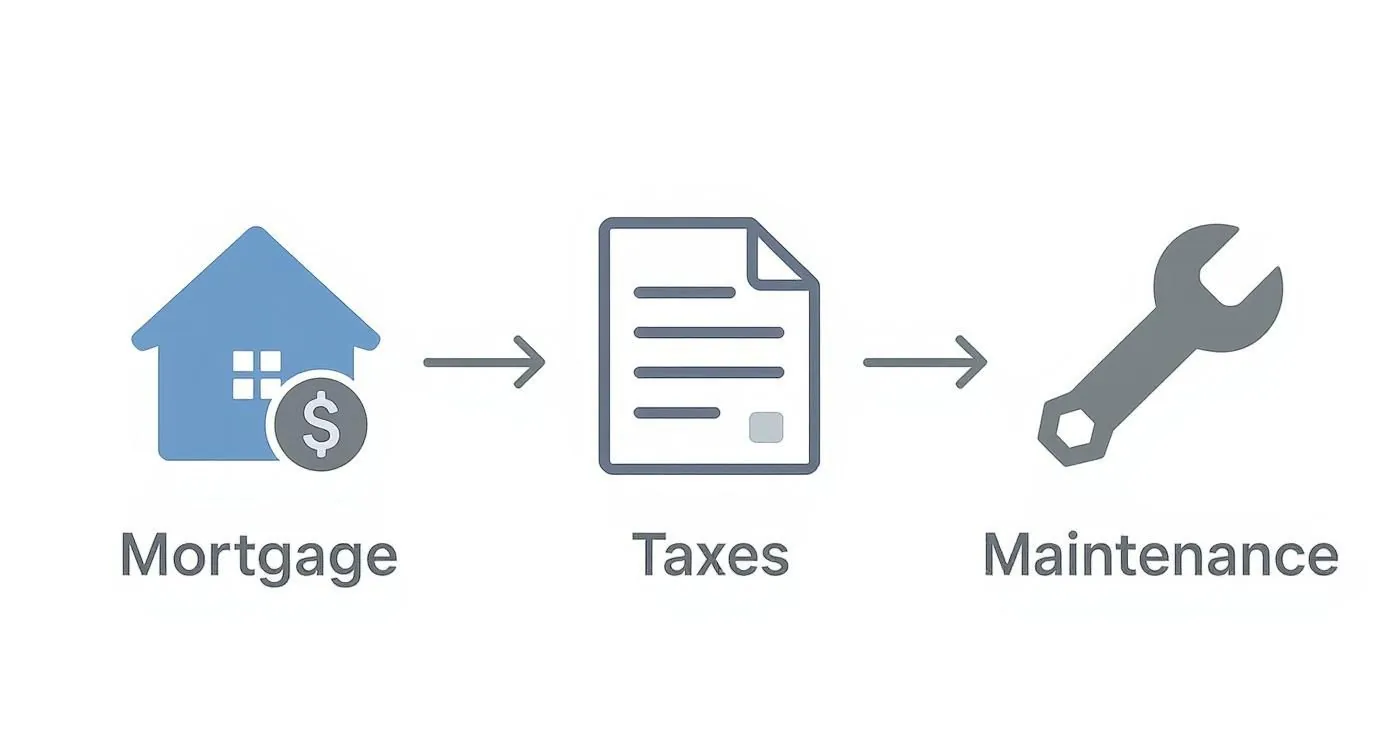
As you can see, gross income is just the starting point. The real profit is what’s left after chipping away at a whole host of costs.
Finding Your Net Operating Income
Your Net Operating Income acts as the crucial bridge between what you collect in rent and what you actually keep. The formula is refreshingly simple, but it’s one of the most powerful tools for comparing different investment properties.
NOI = Effective Gross Income (EGI) - Total Operating Expenses
You’ll notice the mortgage payment (both principal and interest) is left out. That’s intentional. By excluding the debt, NOI lets you judge a property on its own merits, regardless of how it was financed. It creates a level playing field for comparison.
Let’s jump back to our duplex example. We already figured out it has an Effective Gross Income of $36,480 per year and total annual operating expenses of $13,176 (which is $1,098 monthly).
- Annual NOI: $36,480 (EGI) - $13,176 (Expenses) = $23,304
- Monthly NOI: $23,304 / 12 = $1,942
This $1,942 is the money the property generates each month. Its job is to cover your mortgage payment and, with any luck, leave a nice profit behind. To get this right, you also need to be aware of local tax rules; this essential guide to rental income tax in the Netherlands is a perfect example of the kind of specific information you’ll need.
Key Takeaway: A property with a healthy, positive NOI is a solid asset. If the NOI is negative, the property can’t even pay its own bills, let alone the mortgage. That’s a massive red flag for any investor.
The Final Step: Calculating Your Cash Flow
This is the moment of truth. Cash flow answers the single most important question you have: “How much money am I actually making?” It’s the profit left over after every single bill has been paid, including the big one—the mortgage.
Cash Flow = Net Operating Income (NOI) - Total Mortgage Payment (Principal + Interest)
This final number tells you if your investment is putting money in your pocket or taking it out. Let’s say the mortgage on our duplex is $1,500 per month.
- Monthly Cash Flow: $1,942 (NOI) - $1,500 (Mortgage) = $442
- Annual Cash Flow: $442 x 12 = $5,304
That $442 is the real, spendable profit you pocket every month. It’s your reward for taking the risk, and it’s the capital you can use to save, reinvest, or handle those surprise repairs. For a deeper dive, our guide on how to track cash flow for your rental properties has some great strategies.
To bring it all home, let’s put our duplex example into a single table, showing the journey from potential income to actual cash in hand.
From Gross Income to Net Cash Flow: A Complete Example
| Financial Metric | Formula | Monthly Value | Annual Value |
|---|---|---|---|
| Gross Potential Income | Rent per Unit x 12 x # of Units | $3,200 | $38,400 |
| Vacancy Loss | GPI x Vacancy Rate (5%) | ($160) | ($1,920) |
| Effective Gross Income | GPI - Vacancy Loss | $3,040 | $36,480 |
| Total Operating Expenses | Sum of All Expenses (Excl. Mortgage) | ($1,098) | ($13,176) |
| Net Operating Income | EGI - Operating Expenses | $1,942 | $23,304 |
| Mortgage Payment | Principal + Interest | ($1,500) | ($18,000) |
| Net Cash Flow | NOI - Mortgage Payment | $442 | $5,304 |
This table neatly lays out how a property with $38,400 in potential rent ultimately produces $5,304 in annual profit after accounting for vacancies, operational costs, and financing.
This whole exercise proves a critical lesson for new investors: high rent doesn’t automatically mean high profit. An expensive property with a huge mortgage can easily lose you money, even if it brings in a lot of rent. The only way to know for sure is to do the math, from top to bottom.
Using Key Metrics to Make Smarter Investments
Once you’ve figured out your Net Operating Income (NOI) and cash flow, you’ve laid the groundwork for your investment’s finances. But these numbers aren’t just the finish line—they’re the building blocks for some really powerful metrics that let you analyze deals like a seasoned pro. It’s time to go beyond just adding up rent checks and start using that data to make sharper, more confident decisions.
Two of the most indispensable tools in any real estate investor’s belt are the Capitalization (Cap) Rate and the Cash-on-Cash Return. These aren’t just industry buzzwords; they’re critical lenses for sizing up a property’s potential, stacking it up against other deals, and seeing exactly how hard your money is working for you.
Gauging Potential with the Cap Rate
The Cap Rate is your go-to metric for a quick, down-and-dirty assessment of a property’s unleveraged return. It’s a simple ratio that connects the Net Operating Income to the property’s market value, giving you a clean percentage that’s perfect for comparisons. Think of it as a snapshot of earning potential, totally separate from any financing you might use.
The formula is nice and simple:
Cap Rate = Net Operating Income (NOI) / Current Market Value
Let’s go back to our duplex. Say it has a market value of $400,000 and we know its annual NOI is $23,304.
- Cap Rate: $23,304 / $400,000 = 5.83%
That 5.83% tells you the property is expected to churn out a return of 5.83% of its total value each year, before you account for any mortgage payments. To really get a feel for comparing deals, understanding how to calculate cap rate on rental property is key. It helps you ask the right questions: Is a 5.83% return good for this area? Can I find a better Cap Rate on a similar place just a few blocks away?
Pro Tip: A “good” Cap Rate is all about location. A 5% Cap Rate could be fantastic in a hot, appreciating market like San Francisco, whereas a 10% Cap Rate might just be average in a slower-growth town. Always measure a property’s Cap Rate against its local peers.
Measuring Your Actual Return with Cash-on-Cash
While the Cap Rate gives you an apples-to-apples way to compare different properties, the Cash-on-Cash Return gets personal. It answers the question every investor really cares about: “For the actual cash I pulled out of my wallet, what return am I getting?” This metric zeroes in on the performance of your own invested capital—your down payment and closing costs.
Here’s how you figure it out:
Cash-on-Cash Return = Annual Pre-Tax Cash Flow / Total Cash Invested
Let’s say you put down $85,000 in total cash to buy that duplex (an $80,000 down payment plus $5,000 in closing costs). We’ve already calculated the annual cash flow is $5,304.
- Cash-on-Cash Return: $5,304 / $85,000 = 6.24%
That 6.24% is a potent number. It means for every single dollar you personally put into the deal, you’re getting back a little over six cents in profit each year. For any investor using a loan, this might be the single most important metric, because it shows how well your down payment is actually generating a return. If you want to dive deeper into different ways to measure performance, our guide on how to calculate your overall rate of return offers some other great perspectives.
Putting It All Together for Better Decisions
Getting a handle on these two metrics gives you the power to look at deals from multiple angles, which is exactly what smart investors do.
- Use the Cap Rate to quickly sift through and compare different properties on a level playing field, no matter how you intend to finance them.
- Use the Cash-on-Cash Return to get a clear view of your personal return on investment and see how different loan terms could boost or shrink your profits.
When you move past basic income math and start applying these key indicators, you transform from a passive landlord into an active, data-driven investor. This is the skill that separates the pros—letting you spot the winning deals, dodge the duds, and build a truly profitable portfolio.
Common Questions About Calculating Rental Income
Even with all the formulas laid out, the real world of landlording always throws a few curveballs. Let’s tackle some of the most common questions that pop up when you’re running the numbers. Getting these right can save you from the kind of headaches that trip up even seasoned investors.
How Should I Estimate Future Maintenance and Repair Costs?
Guessing what you’ll spend on maintenance is a surefire way to kill your cash flow. You need a system.
A popular rule of thumb is the 1% Rule, where you budget 1% of the property’s purchase price for annual repairs. So, for a $300,000 property, that’s $3,000 a year, or a nice, clean $250 per month. Simple.
Another solid approach is to slice up your gross rent. Many investors set aside 5-10% for routine maintenance (think leaky faucets and running toilets) and another 5-10% for the big-ticket items down the road, known as Capital Expenditures or CapEx.
But if you really want to sleep well at night, get a professional inspection of the major systems—roof, HVAC, water heater. Knowing you have five years left on a roof that costs $10,000 to replace lets you plan for it, instead of getting a nasty surprise on a rainy day.
What Is the Difference Between Cap Rate and Cash on Cash Return?
This is a big one. Both of these metrics measure profitability, but they’re looking at it from two completely different angles. You need both to get the full picture.
-
Cap Rate (NOI / Property Value): Think of this as the property’s own report card. It shows the return based purely on its income-generating power, completely ignoring any loans. This makes it the perfect tool for comparing one property against another in the open market. It answers the question, “How good of a deal is this property, period?”
-
Cash-on-Cash Return (Annual Cash Flow / Total Cash Invested): This metric is all about you. It measures the return on the actual money you pulled out of your pocket—your down payment, closing costs, and initial repairs. It’s a personal number that tells you how hard your capital is working for you, and it’s heavily influenced by your financing terms.
Bottom line: Cap Rate helps you find a good investment. Cash-on-Cash Return tells you if it’s a good investment for you.
Can I Include My Mortgage Principal Payment as an Expense?
This is a classic point of confusion for new landlords. The short answer is no—at least not when you’re calculating your Net Operating Income (NOI).
Your mortgage payment is made of two parts: principal and interest. The interest is a deductible expense for tax purposes, but the principal is not an operating cost. Paying down your principal is simply you paying back your loan and building equity in the asset. It’s a balance sheet transaction, not an income statement one.
Key Distinction: For NOI, you leave the entire mortgage payment out of the equation. But when you move on to calculate your final Cash Flow, you subtract the full mortgage payment (both principal and interest) from your NOI.
Keeping these two separate allows you to analyze the property’s performance (NOI) without your personal financing structure clouding the view.
How Can Software Help Automate These Calculations?
Trying to track all this in a spreadsheet is a rite of passage for many investors, but it’s one you’ll want to graduate from quickly. It’s tedious and dangerously easy to make a mistake. A single typo or a forgotten receipt can completely distort your financial picture.
This is where modern property management software comes in. Instead of wrestling with formulas, you just log your rental payments and expenses as they happen. The platform does the heavy lifting, instantly calculating your NOI, cash flow, and other key metrics in real-time. It not only saves you a ton of time but also gives you an accurate, up-to-the-minute dashboard to make smarter decisions about your portfolio.
Ready to stop juggling spreadsheets and get a clear, real-time view of your rental property’s performance? With PopaDex, you can effortlessly track rental income, expenses, and all other assets to see your complete financial picture in one place. Take control of your investments today. Learn more and get started for free at PopaDex.