Our Marketing Team at PopaDex
How to Create Financial Projections That Impress Investors

Building financial projections isn’t about gazing into a crystal ball. It’s about methodically piecing together your company’s story—past, present, and future—using numbers. The process boils down to gathering your historical data, defining some smart assumptions about what drives your business, and then building out the three core financial statements. Done right, this turns a pile of raw numbers into a strategic roadmap.
Building Your Foundation for Reliable Projections
Before you even think about opening a spreadsheet, let’s talk about the real secret to a forecast that can withstand scrutiny: the groundwork. I’ve seen countless projections fall apart not because of a bad formula, but because the foundation was shaky. This goes beyond number-crunching; it’s about building on clean data, understanding your purpose, and knowing what makes your business tick.
Gather and Clean Your Financial History
First things first, you need to look back before you can look forward. Pull at least two to three years of your income statements, balance sheets, and cash flow statements. This history is your baseline—it shows the trends and patterns that will inform your future assumptions.
It’s absolutely critical to clean this data. Did you have a one-off, massive legal expense last year? A huge, non-recurring sale that’s unlikely to happen again? You need to identify these anomalies and either remove them or make a note of them. If you don’t, they’ll throw off your entire projection.
Your goal is to create a “normalized” view of your past performance. This provides a stable, realistic foundation from which you can project future activity without being misled by historical outliers.
Pinpoint Your Core Business Drivers
Every business has a unique set of levers that control its growth and costs. For a SaaS company, it might be all about website conversion rates and customer churn. For a retail shop, it’s foot traffic and the average amount each customer spends. Nailing down these specific drivers is what separates a wild guess from a projection grounded in reality.
One of the most effective techniques I’ve used for this is the percent of sales method. It’s a simple but powerful way to keep your projections internally consistent. The idea is to express key costs as a percentage of your total sales, based on your historical data. For instance, if your cost of goods sold (COGS) has consistently hovered around 30% of sales, you can confidently apply that same percentage as you project future sales growth. It’s a great way to ensure your costs scale realistically with your revenue.
Define the Purpose of Your Projection
Finally, you have to be crystal clear on why you’re even building this projection. The story you tell with your numbers—and the level of detail you provide—will change dramatically depending on who’s looking at it.
- For a Bank Loan: Lenders are all about risk mitigation. They want to see stability and a clear ability to repay the loan. Your projections should lean conservative, emphasizing predictable cash flow.
- For a VC Pitch: Venture capitalists, on the other hand, are hunting for explosive growth. Your forecast needs to scream scalability and massive market opportunity. Here, you can be more aggressive with your assumptions, but you’d better be able to back them up.
As you start laying out your costs and funding needs, especially if you’re pursuing specific types of financing, a solid grant budget template can be an invaluable tool to keep things organized and professional.
The Three Pillars of Financial Projections
At the heart of any solid financial forecast are three interconnected statements. Think of them as three different lenses for viewing your business’s financial health. Each one tells a different part of the story, and together, they provide a complete picture.
| Statement | What It Reveals | Key Projection Items |
|---|---|---|
| Income Statement | Your company’s profitability over a period (e.g., month, quarter, year). | Revenue, Cost of Goods Sold (COGS), Operating Expenses, Net Income |
| Balance Sheet | A snapshot of your financial position at a single point in time. | Assets (Cash, Accounts Receivable), Liabilities (Loans, Accounts Payable), Equity |
| Cash Flow Statement | How cash moves in and out of your business from operations, investing, and financing. | Net Cash from Operations, Capital Expenditures, Changes in Debt |
Mastering how these three statements work together is fundamental. Your net income from the income statement flows into the equity on your balance sheet, and changes in your balance sheet items (like inventory or receivables) directly impact your cash flow.
How to Build a Defensible Sales Forecast

Let’s be blunt: your revenue forecast is the engine of your entire financial model. If you get it wrong, the rest of your plan is just a work of fiction. A vague or wildly optimistic sales projection is one of the fastest ways to lose credibility, whether you’re talking to investors or lenders.
What you need is a forecast that feels ambitious but is firmly grounded in reality—a set of numbers you can stand behind and defend. The trick is to move beyond simple guesswork and lean on established methods. Two powerful approaches dominate sales forecasting: top-down and bottom-up analysis. Getting a handle on both will help you build a much more robust plan.
The Big-Picture Top-Down Approach
The top-down approach is all about starting with the biggest possible market and then carving out your slice. It’s a fantastic way to frame the overall opportunity and is often a favorite for early-stage startups trying to show VCs the potential scale of their idea.
This method boils down to three key estimates:
- Total Addressable Market (TAM): This is the total potential revenue available if you somehow achieved 100% market share. It’s your “pie in the sky” number.
- Serviceable Available Market (SAM): This is the segment of the TAM you can realistically reach with your current business model, accounting for things like geography or language barriers.
- Serviceable Obtainable Market (SOM): This is the portion of your SAM you can realistically capture in the near term, considering your competition, marketing budget, and team. This is your actual target.
Real-World Example (SaaS Startup): Imagine you’re launching a project management tool. The global TAM might be $20 billion. Your SAM, however, could be $5 billion if you’re only focusing on English-speaking small businesses. From there, your SOM for the next three years might be $50 million—the slice you genuinely believe you can win from competitors with your unique features.
The Granular Bottom-Up Approach
While top-down is great for painting the vision, the bottom-up approach is where you build credibility through operational detail. You start with what you can actually do—your internal capabilities—and build the forecast from the ground up. Honestly, this method is usually more accurate for existing businesses or for mapping out your first year’s monthly budget.
Instead of thinking about market size, you focus on tangible drivers you can control. For an e-commerce brand, this means forecasting website traffic, conversion rates, and average order value. For a B2B company, it’s all about the number of salespeople, their quotas, and their historical close rates.
Real-World Example (E-commerce Brand):
- Projected monthly website visitors: 50,000
- Expected conversion rate: 2%
- Average order value: $75
Your monthly sales forecast would be 50,000 visitors x 2% conversion rate x $75 = $75,000. The power of this approach is that each input is a lever you can actually pull. Want to grow revenue? Increase traffic, improve conversion, or find ways to boost the average order.
Blending Methods for a Bulletproof Forecast
The most defensible financial projections don’t just pick one method; they use both as a check and balance against each other. Start with a bottom-up forecast to ground your projections in what’s actually achievable day-to-day. Then, layer on a top-down analysis to make sure your obtainable market (SOM) is large enough to support your bottom-up growth ambitions.
If your bottom-up plan requires you to capture 90% of the market in your first year, you’ve got a reality-check problem.
Some businesses also lean on historical trends. One of the most foundational methods is straight-line forecasting, which just applies a past growth rate to predict future revenue. A business with a steady 5% annual growth can project future years by compounding this rate. Just be careful, as this simple method can easily overlook market volatility and sudden shifts.
By building your sales plan this way, you create a far more compelling narrative. The top-down view shows the massive opportunity, while the bottom-up plan details exactly how you’ll go about seizing it. This dual approach is essential for creating financial projections that are both inspiring and believable. To take your model to the next level, check out our guide on scenario forecasting and financial planning.
Projecting Expenses Without Underestimating Costs
 A stellar revenue forecast is a fantastic start, but it’s only one side of the coin. Now, we need to get real about what it’s going to cost to make that revenue happen. This is where so many founders stumble, letting enthusiasm cloud their judgment and leading to severely underestimated costs. That’s a fast track to a cash flow crisis.
Projecting your expenses goes beyond making a list of bills. It’s about truly understanding the relationship between what you spend and how you grow. The trick is to break down your costs into different buckets, because each one behaves differently as your business scales.
Separating Variable and Operating Expenses
First things first, let’s split your costs into two main categories: variable costs and operating expenses (OpEx).
Variable costs, which you’ll often see called Cost of Goods Sold (COGS), are directly tied to delivering your product. Sell more, and these costs go up. For an e-commerce shop, this is the cost of the products you sell and the fees to ship them. For a SaaS company, it might be your server hosting fees or the cost of a third-party API you rely on.
Operating expenses, on the other hand, are the fixed costs of keeping the lights on, no matter how much you sell. Think of them as the predictable, steady pulse of your business. This bucket includes things like:
- Office rent and utilities
- Salaries for your non-production team (admin, marketing, etc.)
- Insurance premiums
- Marketing and advertising budgets
Getting this distinction right is absolutely vital. Your variable costs should climb in lockstep with your revenue, while your operating expenses should stay relatively stable, only increasing in predictable jumps when you hit major growth milestones.
Building a Realistic Hiring and Payroll Plan
One of the biggest—and most frequently underestimated—operating expenses is payroll. Please, don’t just guess at a single number for salaries. A credible projection needs a detailed headcount plan.
Start by listing your current team and what they’re paid. Next, map out future hires based on specific growth triggers. For example, maybe you decide to hire a new customer support agent for every 500 new customers. Or perhaps you’ll bring on a new salesperson once you hit a regional sales target.
A classic mistake I see all the time is forgetting the “fully loaded” cost of an employee. This is often 25-40% higher than their base salary. It includes payroll taxes, health insurance, retirement contributions, and other benefits. Ignoring this buffer can absolutely wreck your cash flow.
Accounting for Major Capital Expenditures
Finally, don’t forget to account for capital expenditures (CapEx) in your projections. These aren’t your typical, day-to-day operating costs. They are big, long-term investments in assets that will benefit your business for more than a single year.
We’re talking about major purchases like:
- New manufacturing equipment
- Buying an office building instead of renting
- A massive software development project
CapEx gets treated differently on your financial statements. An operating expense like rent hits your income statement immediately. But a capital expenditure is recorded as an asset on your balance sheet and then gradually expensed over its “useful life” through something called depreciation. This distinction is crucial for building accurate, interconnected financial statements and getting a true picture of your company’s long-term health and cash needs.
Connecting Your Three Core Financial Statements
You’ve put in the hard work forecasting your revenue and mapping out your expenses. Now for the satisfying part: weaving those threads into a cohesive financial story. This is where your assumptions truly come to life, linking the three core statements—the Income Statement, the Cash Flow Statement, and the Balance Sheet.
Forget those dry accounting classes you might have taken. The best way to think about these documents is that they’re in a constant conversation with each other. What happens on one directly impacts the others. Grasping this dynamic is what elevates a simple spreadsheet into a powerful, predictive model that can genuinely guide your business.
The Interconnected Financial Story
At its heart, the connection is pretty logical. Your Income Statement tallies up your profitability over a specific period, ending with that all-important net income line.
That net income figure then becomes the starting point for your Cash Flow Statement. This statement adjusts for any non-cash items (like depreciation) and changes in working capital to reveal how much actual cash your business generated or used.
Finally, the ending cash balance from your Cash Flow Statement pops up on your Balance Sheet as your cash asset. The net income also finds its way to the Balance Sheet, updating the “retained earnings” in the equity section. When everything is linked up correctly, your Balance Sheet will balance—your total assets will equal your total liabilities plus equity. It’s the ultimate check to know your model is mathematically sound.
A common—and dangerous—misconception is that profitability equals cash. A business can look wildly profitable on its Income Statement but still run out of money because all its cash is tied up in unpaid customer invoices (accounts receivable) or sitting in a warehouse as unsold inventory. This is exactly why the Cash Flow Statement is often called the lifeblood of a growing business.
This infographic breaks down how to approach your expense forecast, which is a critical piece of the puzzle for all three statements.
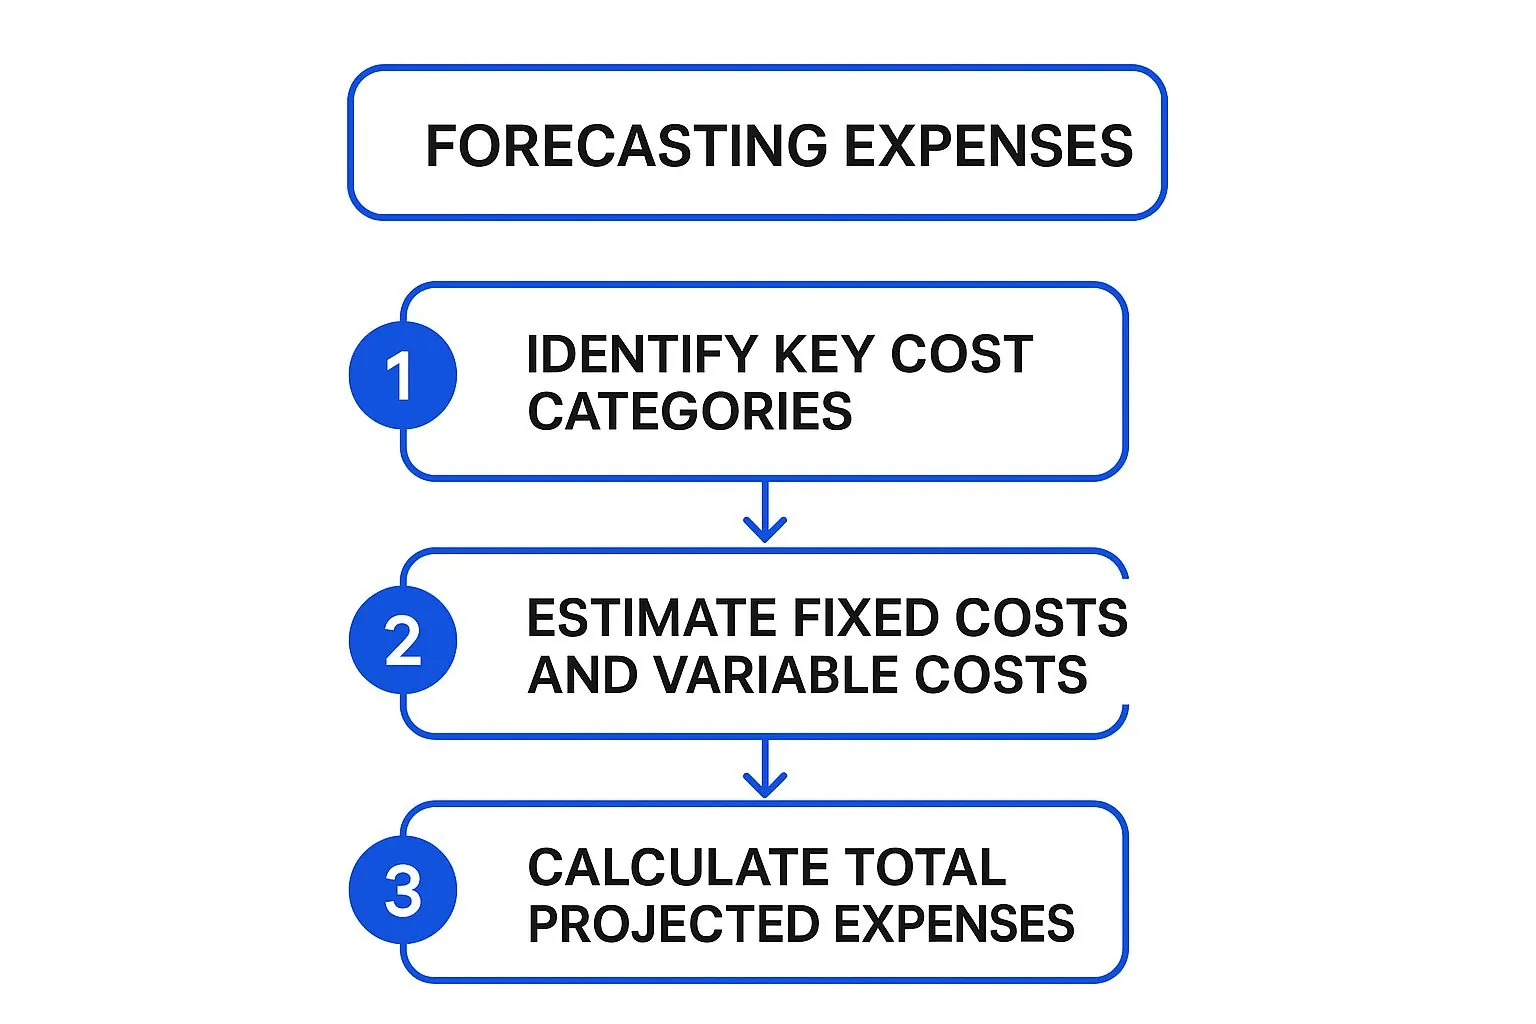
As you can see, a solid expense forecast begins with categorizing your costs before you even start estimating them. This structured approach is key to building a comprehensive financial model.
Tracing the Numbers: A Practical Example
Let’s follow a single transaction to see how this all works in practice. Imagine your e-commerce business makes a $1,000 sale on credit in January.
-
Income Statement: Your revenue immediately increases by $1,000. If the cost of those goods was $400, your gross profit is $600. This profit then trickles down to your net income.
-
Cash Flow Statement: Here’s the key part—since the customer hasn’t paid you yet, you haven’t actually received any cash. Your cash flow from operations will actually decrease (or be less positive) because your accounts receivable—the money owed to you—has gone up by $1,000.
-
Balance Sheet: On the asset side, your accounts receivable goes up by $1,000, while your inventory drops by $400. Over on the equity side, your retained earnings increase by whatever your net income was for the period.
As you work to link your three core financial statements, remember that accurate cash flow forecasting is absolutely vital for your company’s financial health. For some practical tips, you might want to explore these strategies to manage cash flow effectively.
Building these connections manually can get complicated fast, which is why many founders turn to templates or specialized software. A platform like PopaDex simplifies this by tracking your assets and liabilities in real time, giving you a solid foundation for your projections. For a deeper look at structuring your numbers from the ground up, our guide on creating a financial plan provides an excellent framework.
When these statements are properly linked, you have a dynamic tool that shows you precisely how a single change—like a delayed customer payment or an unexpected expense—will ripple through your entire financial future.
How to Stress-Test and Refine Your Model

Getting your financial model built isn’t the finish line; it’s really just the starting point. A static model is fine, but the real magic happens when you start pushing its buttons and pulling its levers. This is where you stress-test your numbers, transforming a simple forecast into a dynamic tool that prepares you for what the market might actually throw at you.
It’s all about uncovering hidden risks and, just as importantly, spotting unseen opportunities.
Start With Scenario Analysis
The best way to kick things off is with scenario analysis. This technique is all about moving beyond a single “most likely” forecast and creating a few different versions of your financial future. You’re not just planning for the outcome you expect; you’re getting ready for the ones you don’t.
I always recommend building out at least three core scenarios:
- Best-Case: This is your blue-sky, optimistic outlook. What if that new marketing campaign absolutely crushes it, or a product takes off way faster than you planned?
- Worst-Case: Here, you have to confront your biggest fears head-on. What if your largest client walks, or customer acquisition costs suddenly double? This helps you find your financial breaking point.
- Base-Case: This is your original projection—the realistic, middle-of-the-road path that sits between the two extremes.
Putting these scenarios together gives you a much richer understanding of your business’s resilience. It helps you answer tough but critical questions, like exactly how much cash you need to keep in the bank to weather a serious downturn.
Uncover Your Most Critical Assumptions
Once your scenarios are mapped out, it’s time to dig a little deeper with sensitivity analysis. This is how you pinpoint which of your assumptions packs the biggest punch to your bottom line. Is your whole model hanging on keeping customer churn below 2%? Or does a 10% swing in ad spend make a bigger dent?
The process is straightforward: you systematically tweak one key variable at a time—like your sales conversion rate or raw material costs—while holding everything else constant. This immediately reveals which levers have the most influence over your profitability and cash flow, showing you exactly where you need to focus your attention and monitoring efforts.
A financial model is only as strong as its weakest assumption. Sensitivity analysis is how you find that weak link before it has a chance to break.
For a more sophisticated approach, you can explore statistical methods that model the relationships between different variables. Regression analysis, for instance, has long been a cornerstone of advanced forecasting, helping to estimate how changes in one variable (like marketing spend) impact another (like revenue). This lets you move beyond simple straight-line projections and account for more complex, real-world dynamics. If you’re curious, you can learn more about these forecasting methods to enhance your financial models.
Ultimately, taking the time to properly stress-test your projections transforms them from a simple forecast into a powerful strategic weapon. It arms you with the foresight needed to navigate an uncertain future with much more confidence.
Common Questions About Financial Projections
Even with the best guides, you’re bound to hit a few snags when you’re deep in the weeds of a spreadsheet. It happens to everyone. Let’s walk through some of the most common questions and sticking points that come up when people are learning how to build financial projections.
Getting these right can be the difference between a model that’s just a confusing mess of numbers and one that acts as a powerful tool for your business strategy.
One of the first questions I always get is about the timeline. For most internal planning and especially for startup pitches, a 3-year projection is the gold standard. You’ll want to break down the first year month-by-month to get granular on operations. For years two and three, you can zoom out to a quarterly or even annual view. While a bold investor might ask for a 5-year forecast, everyone in the room knows that anything beyond year three is more guesswork than science.
Common Sticking Points and Solutions
A classic rookie mistake is getting starry-eyed about revenue while completely lowballing costs—especially for things like marketing and hiring new team members. Another one is confusing profit with cash. They are absolutely not the same thing. A profitable month on paper won’t pay the bills if all your cash is locked up in invoices your clients haven’t paid yet.
But the most dangerous error? A set of disconnected financial statements. If your net income doesn’t perfectly flow into your balance sheet and cash flow statement, the entire model is broken. It’s fundamentally unreliable for making any real-world decisions.
So, should you just grab a template? Yes, definitely. A solid template is a fantastic starting point. It saves you the massive headache of building all the complex accounting links from scratch and makes sure your statements actually balance. But—and this is a big but—a template is not a magic wand. You have to go line by line and customize every single assumption to reflect the unique reality of your business.
What if you’re a brand-new business with zero history to look back on? The game changes completely. Your focus shifts from historical data to building a bottom-up case based on tangible drivers. Start asking practical questions:
- How many sales calls can one rep realistically make in a day?
- What’s a reasonable website conversion rate, based on industry benchmarks?
- What is our absolute maximum production capacity?
You have to back these numbers up with solid market research and data from comparable companies. Your goal is to tell a story that’s not just optimistic, but believable and grounded in real-world actions. In many ways, a good business projection is like a well-structured personal budget; for more on that, our guide on how to budget money offers a great framework for tracking your numbers.
Ready to stop juggling spreadsheets and see your complete financial picture in one place? PopaDex offers intuitive tools to consolidate your accounts, track your net worth in real time, and turn your financial goals into a reality. Get started for free at PopaDex.com and take control of your financial journey today.