
Pension spending by country: Portugal, Denmark and Switzerland
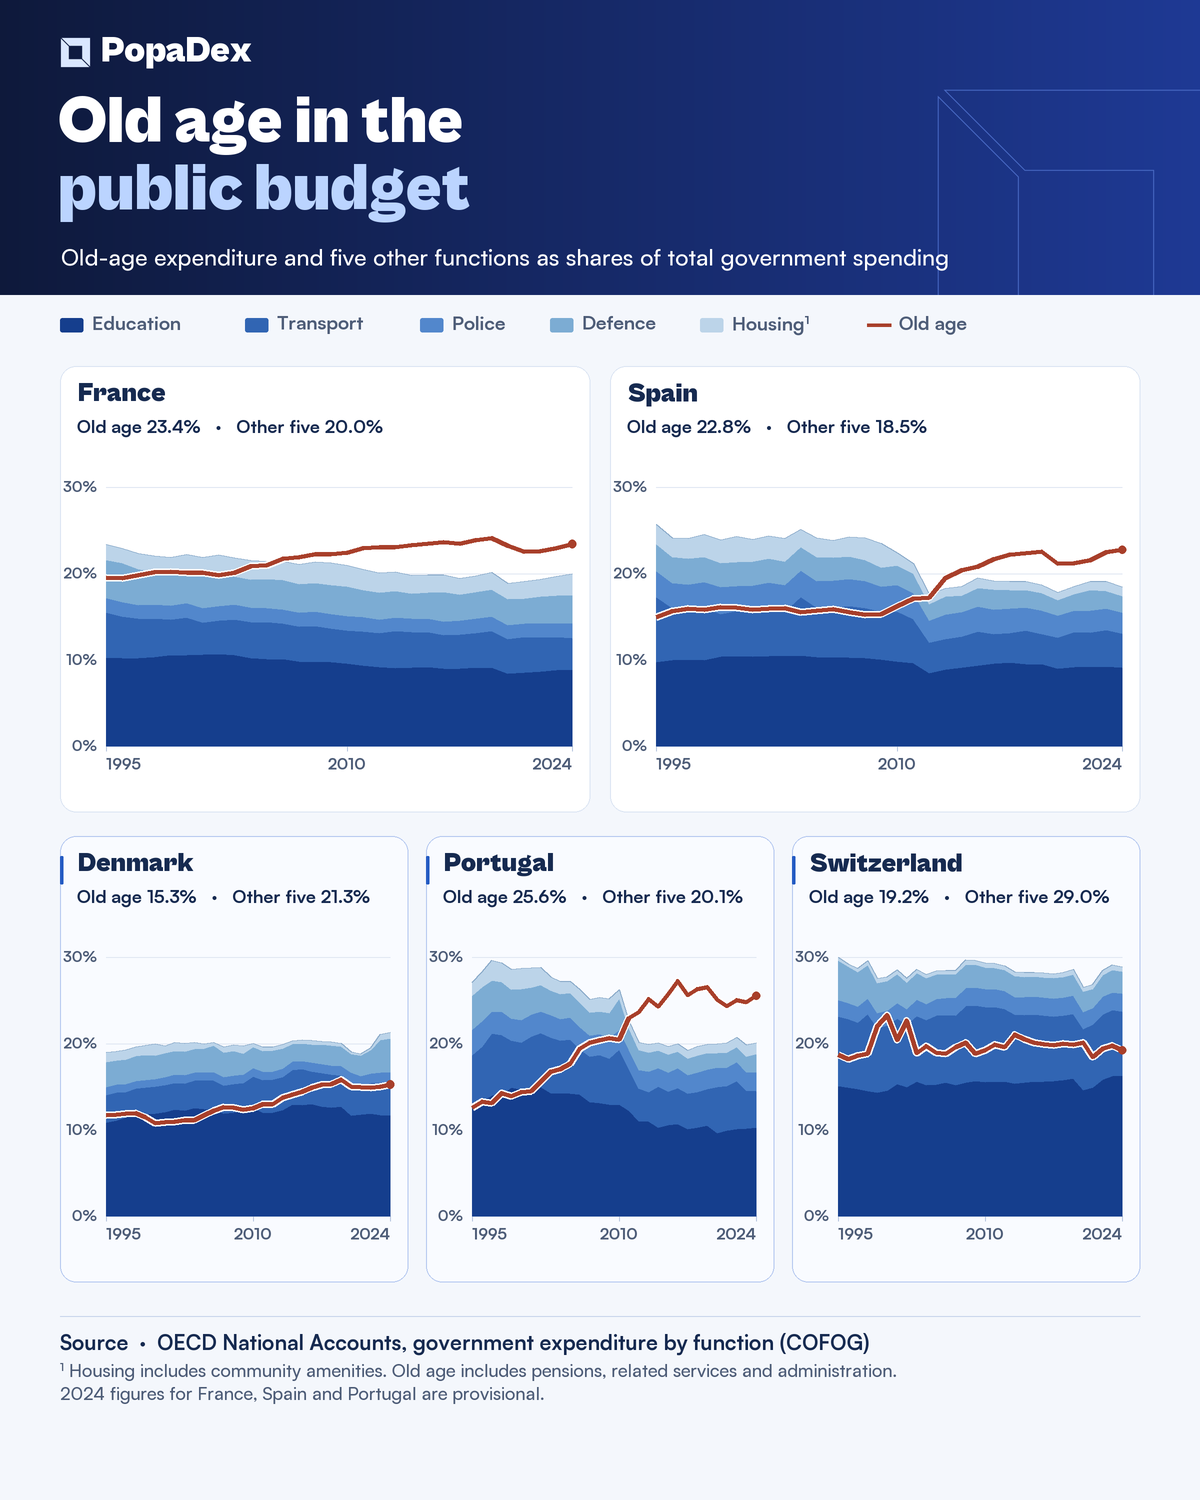
In 2024, Portugal spent 25.6% of its government budget on old-age social protection, compared with 20.1% on education, transport, policing, defence, and housing and community amenities combined. France and Spain showed the same pattern. In Denmark and Switzerland, the five functions together took the larger share. The 2024 figures for Portugal, France and Spain are provisional. OECD government expenditure by function
How much of the public budget goes to old age?
| Country | Old age | Other five |
|---|---|---|
| Portugal | 25.6% | 20.1% |
| France | 23.4% | 20.0% |
| Spain | 22.8% | 18.5% |
| Denmark | 15.3% | 21.3% |
| Switzerland | 19.2% | 29.0% |
Portugal’s share for old age rose from 12.6% in 1995 to 25.6% in 2024. The five other functions together went from 27.1% to 20.1%. These percentages describe how the budget was allocated. A category’s share can fall even while its spending rises in euros. The OECD national accounts classify spending on old age under COFOG, which includes public pensions, related services and administration. OECD national accounts · UN definition of old-age social protection
 Open full-size chart
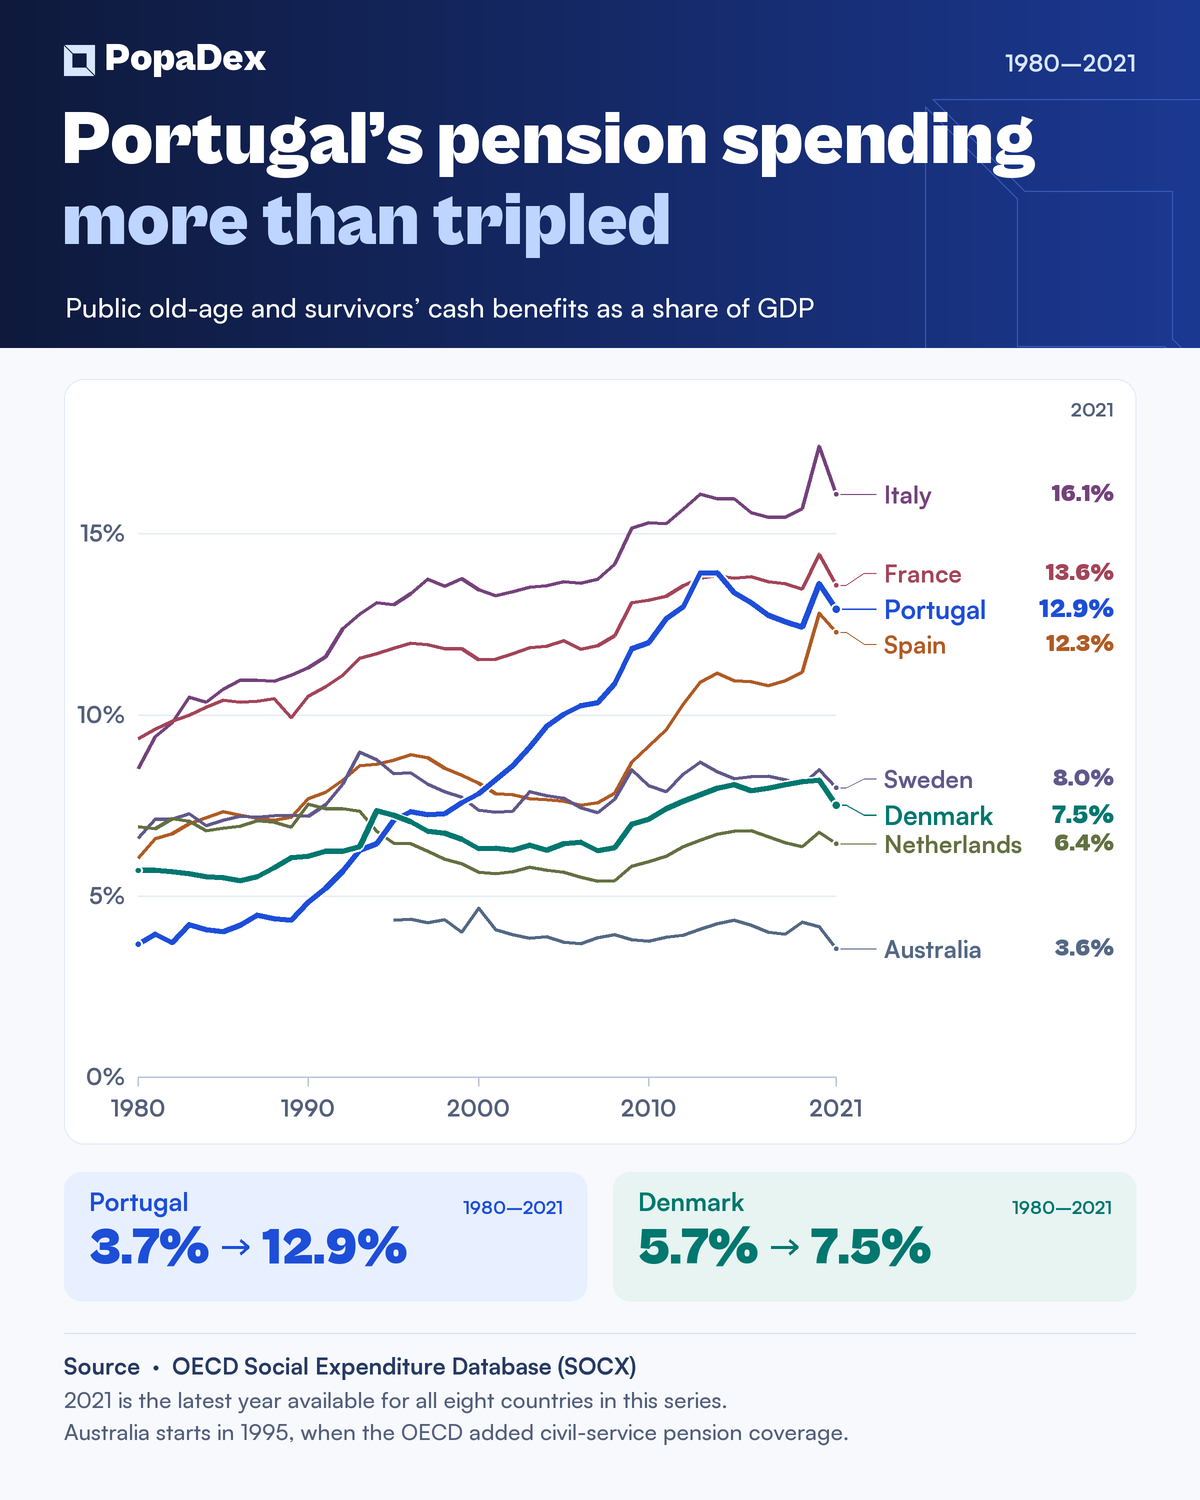
Portugal’s public pension spending more than tripled as a share of GDP
On a narrower measure, public cash benefits for old age and survivors went from 3.7% to 12.9% of GDP in Portugal from 1980 to 2021. Denmark went from 5.7% to 7.5%. The two countries started in the opposite order. The comparison ends in 2021, the latest year common to all eight countries in this series. Australia starts in 1995, when coverage began to include civil-service pensions. OECD Social Expenditure Database · OECD Pensions at a Glance, table 8.2
 Open full-size chart
Taxes and public investment followed different paths
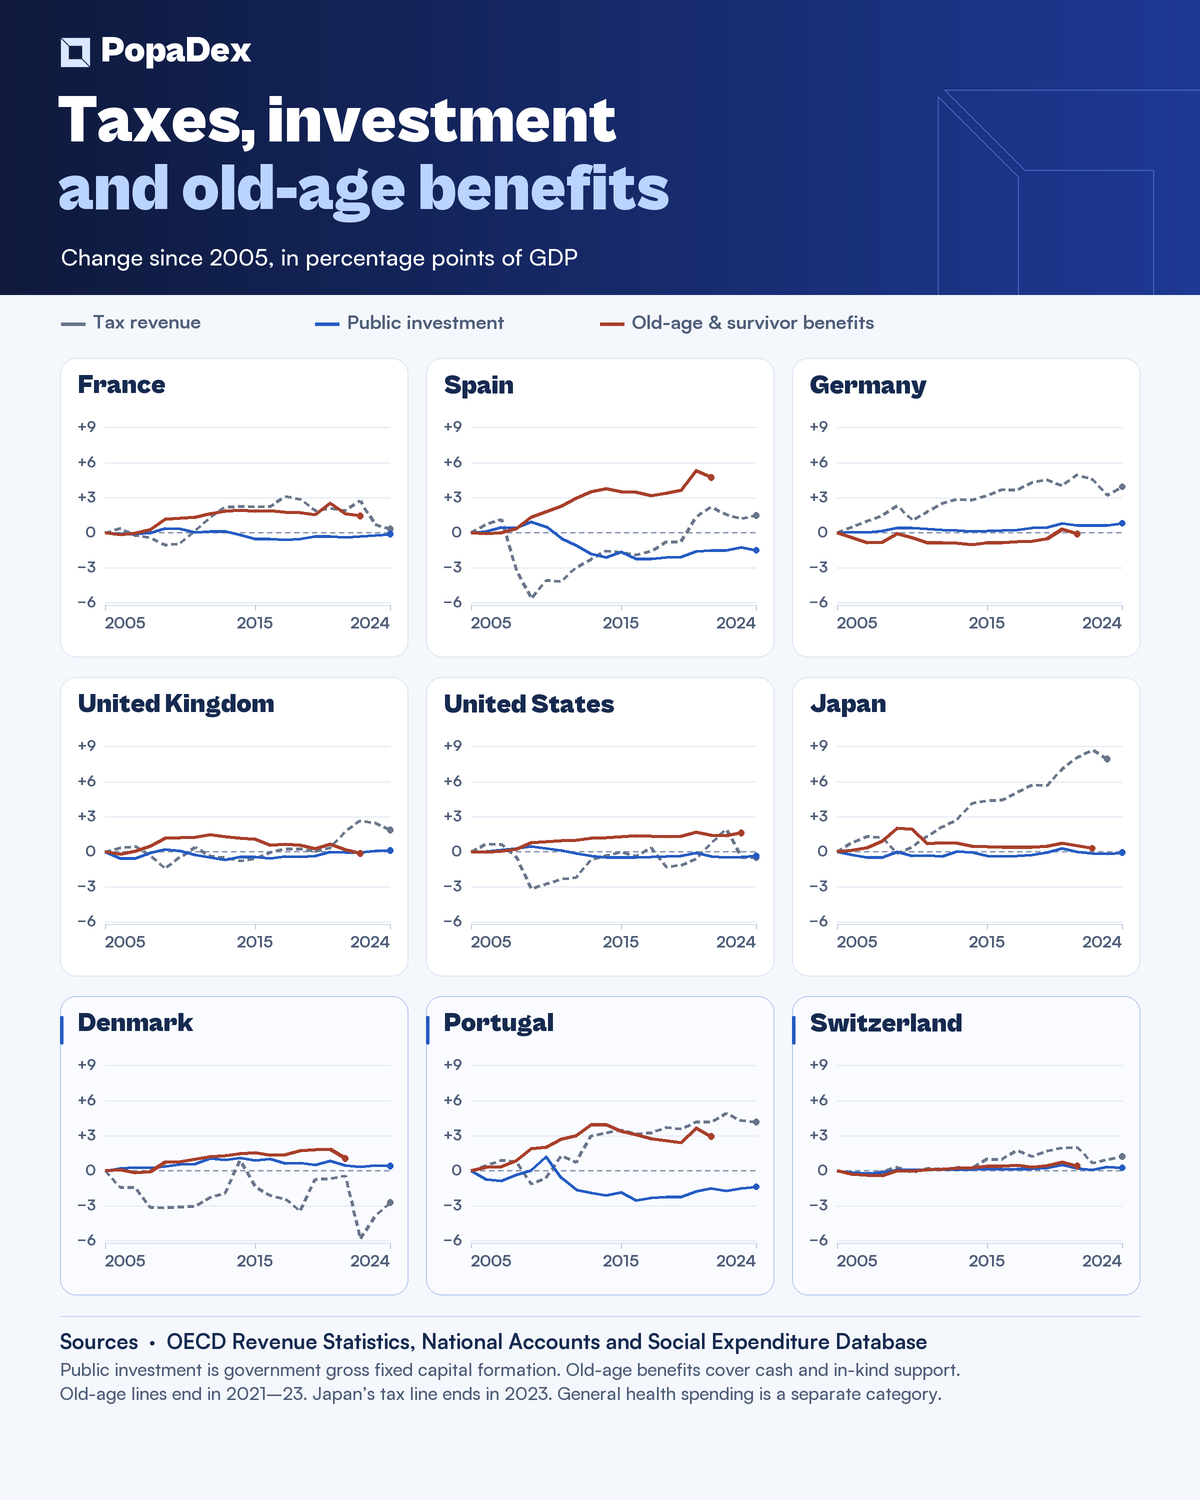
Between 2005 and 2024, tax revenues rose by 4.2 percentage points of GDP in Portugal and public investment fell by 1.4 points. Denmark’s tax take fell by 2.7 points while public investment rose by 0.4 points. In Switzerland, tax revenues and public investment both rose, by 1.2 points and 0.3 points, respectively. Here, public investment means all general government gross fixed capital formation, which includes items such as buildings and equipment. The series show how each share changed. Tracing the use of additional tax revenue would require separate budget evidence. OECD Revenue Statistics · OECD government national accounts
 Open full-size chart
Do older households spend more?
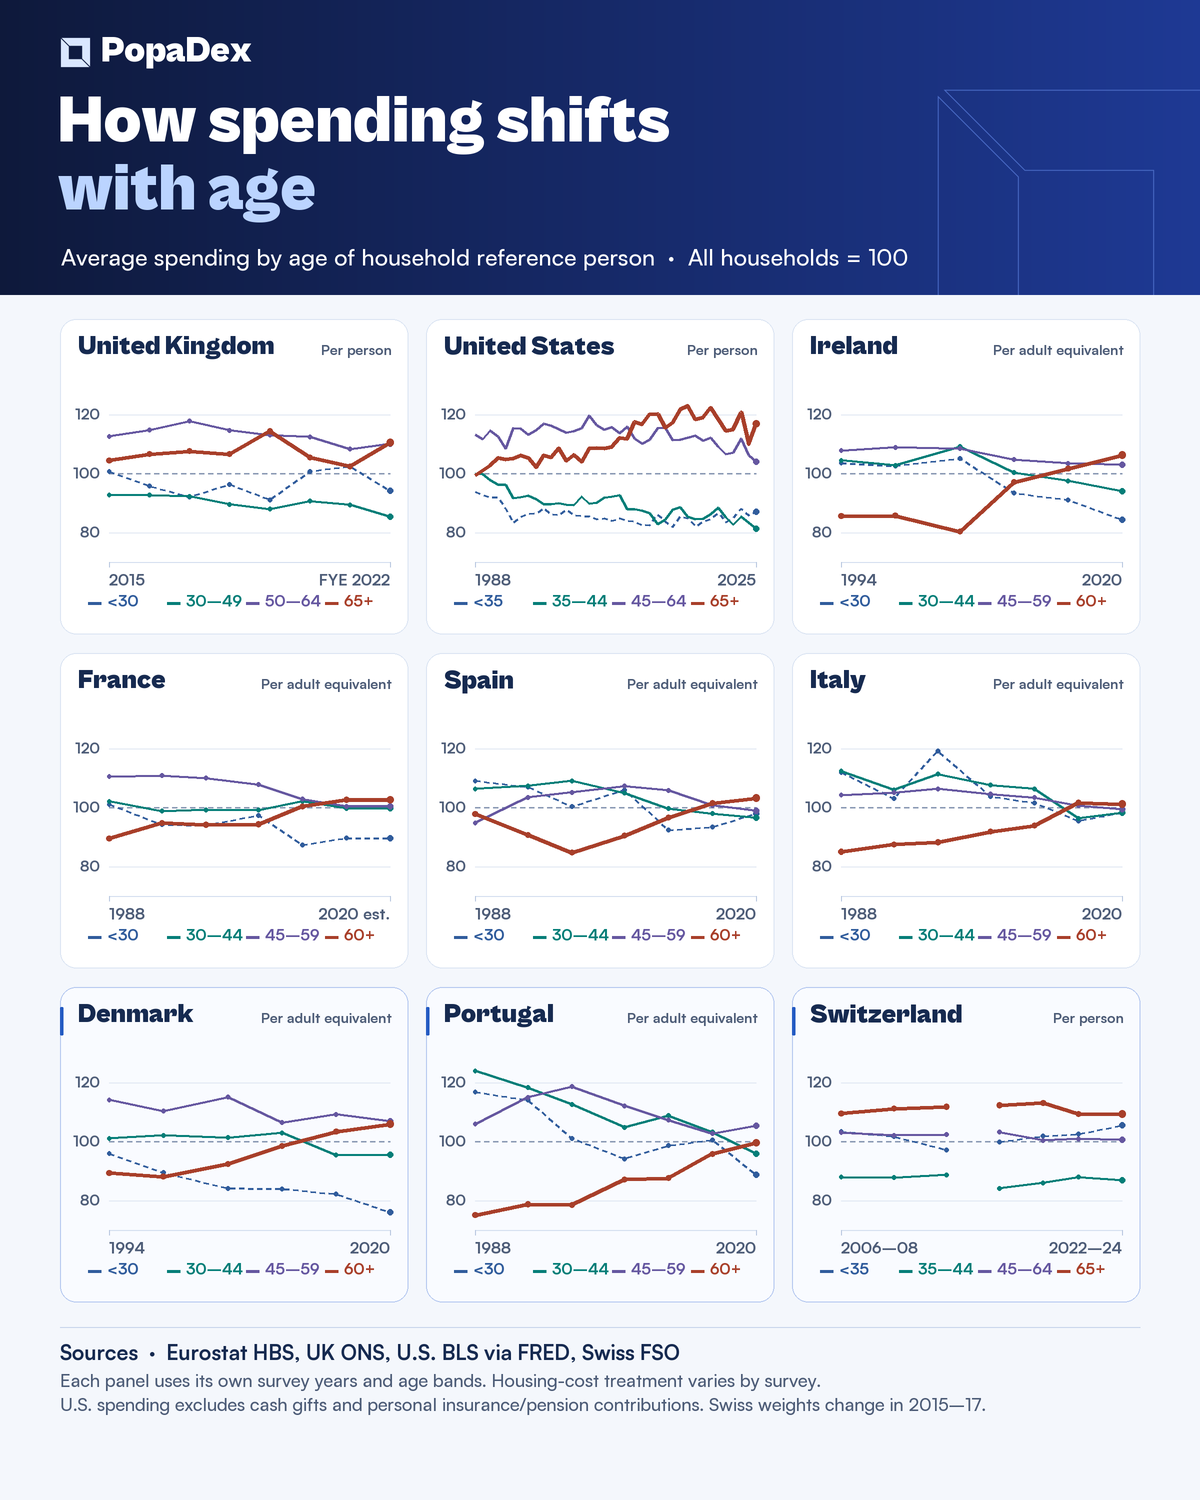
In Denmark’s 2020 survey, households with a reference person aged 60 or older spent about 6% more per adult equivalent than the average across all households. In Portugal, that group spent roughly the average. In Switzerland, households with a reference person aged 65 or older spent about 9% more per person than the Swiss average in 2022–24. Adult-equivalent figures adjust for the size and composition of a household. The age groups identify the survey’s reference person, so they can include workers and other household members. Eurostat Household Budget Survey · Swiss Federal Statistical Office
 Open full-size chart
Sources and calculations
The budget shares divide each function’s expenditure by the same country’s total general government expenditure for that year. The fiscal chart subtracts the 2005 share of GDP from each later observation and leaves gaps where the source has no data. The pension chart uses the OECD’s published ratio for public cash expenditure. OECD Social Expenditure Database · OECD national accounts
The household chart divides each age group’s spending by the all-household average for the same survey period, then multiplies by 100. Eurostat reports spending per adult equivalent. For the UK, US and Switzerland, we use spending per household member and weight combined age groups by reported household counts or shares. The US calculation excludes cash contributions and personal insurance and pension contributions. Housing-cost treatment varies by survey, and the Swiss weights change in 2015–17. These differences limit cross-country comparisons of living standards. UK Office for National Statistics, table A11 · US Bureau of Labor Statistics via FRED · Swiss Federal Statistical Office