
How to Retire Early and Achieve Financial Freedom
The secret to retiring early isn’t some complex financial wizardry. It’s about having a crystal-clear vision, nailing down a specific financial target, and then just relentlessly working the plan. The whole game is about turning that fuzzy dream of “not working anymore” into a real, actionable goal with a finish line you can see.
What Does Early Retirement Actually Look Like for You?
Before you even think about opening a spreadsheet, the most important thing you can do is figure out what “early retirement” truly means to you. If you don’t have a destination in mind, you’re just driving around aimlessly. This vision is your North Star—it will guide every single savings and investment decision you make from here on out.
And forget vague ideas. Get granular. What does a perfect Tuesday look like when you’re free from the 9-to-5? Are you backpacking through Asia, coaching your kid’s soccer team, launching that passion project, or just enjoying a slow morning with a cup of coffee and a good book? The life you imagine directly sets the price tag for your freedom.
Turning the Dream into a Number
Once you’ve painted a picture of your ideal post-work life, it’s time to put a number on it. This is where the concept of Financial Independence (FI) becomes your best friend. FI is simply the point where your investments churn out enough passive income to cover all your living expenses, forever. You no longer need to work for money.
This simple flow chart nails the process: start with the vision, do the math, and land on your target.
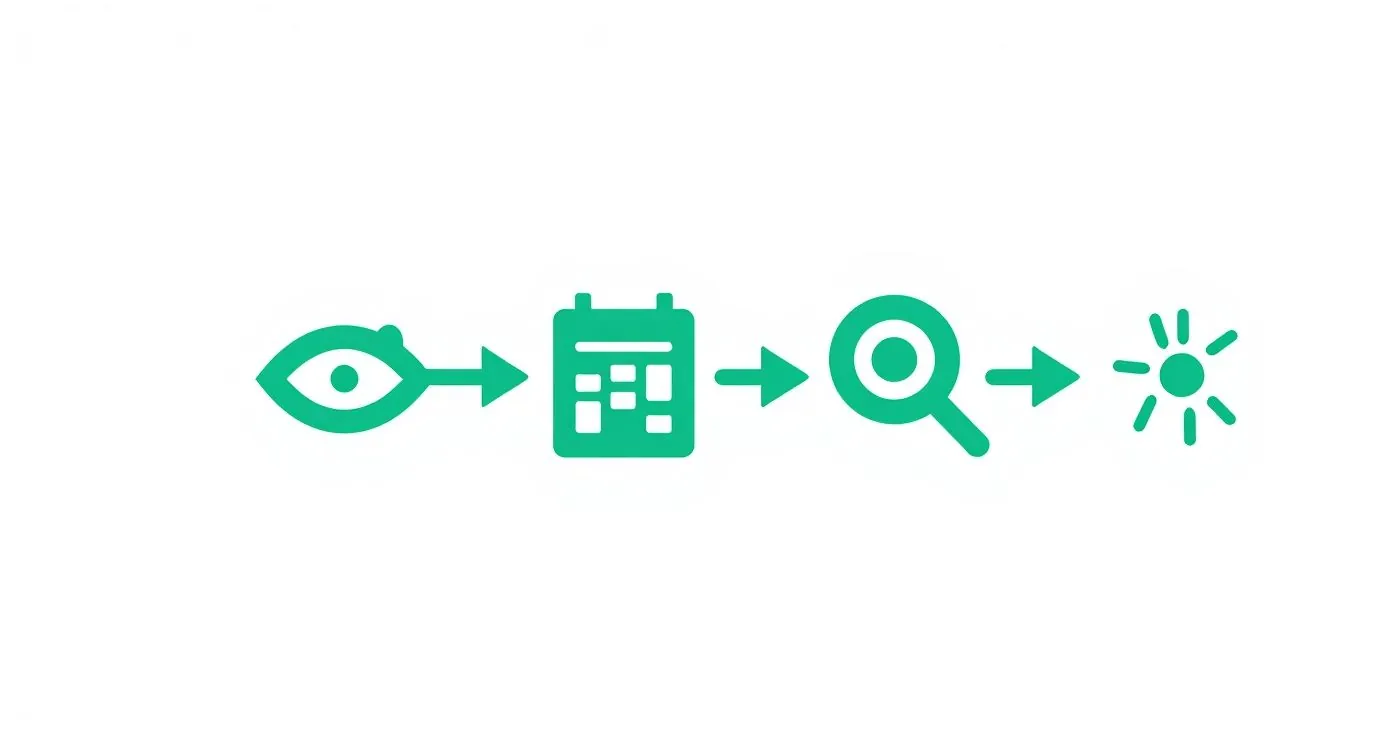
It really is that straightforward. A clear vision leads to a precise calculation, which gives you a defined target to aim for.
A tried-and-true way to calculate your FI number is by using the 4% Rule, often called the safe withdrawal rate (SWR). It’s a rule of thumb suggesting you can safely pull 4% from your investment portfolio each year in retirement without running out of money over the long haul.
To find your FI number, just multiply your desired annual spending in retirement by 25. This simple formula is the bridge between your lifestyle dream and your financial reality.
For instance, if you figure out your ideal retirement will cost $60,000 per year, your target nest egg is $1.5 million ($60,000 x 25). If you can live a fantastic life on $40,000, your target drops all the way down to $1 million.
This calculation is incredibly powerful because it defines the finish line. It’s not some abstract goal anymore; it’s a concrete number you can chase. To get this right, you need to map out the details, and using a structured guide can make all the difference. Check out this financial goal setting worksheet to get started.
Why Your Spending Is the Only Metric That Matters
Notice something? That entire calculation is based on your expenses, not your income. This is a massive distinction. A high-earner with a lavish lifestyle might need a much bigger nest egg than someone with a modest income who lives frugally.
This is exactly why tracking your spending is non-negotiable on the path to FI. You can’t figure out your target number if you don’t know what your life actually costs.
How Your Spending Shapes Your Retirement Target
Here’s a quick table to show you just how much your spending habits control the size of your goal. It’s all based on that 25x spending rule.
| Desired Annual Spending | Required Nest Egg (25x Spending) |
|---|---|
| $40,000 | $1,000,000 |
| $60,000 | $1,500,000 |
| $80,000 | $2,000,000 |
| $100,000 | $2,500,000 |
The takeaway here is pretty stark. Managing your annual expenses has a gigantic impact on the size of the portfolio you need to build. In fact, every single dollar you cut from your yearly budget reduces your retirement target by $25.
This makes mindful spending one of the most powerful levers you can pull in your early retirement arsenal. Your vision sets the destination, but it’s your spending that determines how fast you get there.
Building Your Financial Independence Engine
So, you have a clear destination in mind. Now it’s time to build the machine that will get you there. Reaching early retirement really boils down to a simple, powerful equation: make the gap between what you earn and what you spend as wide as humanly possible. That surplus is the fuel for your investments, and the bigger it is, the faster you’ll hit financial independence.
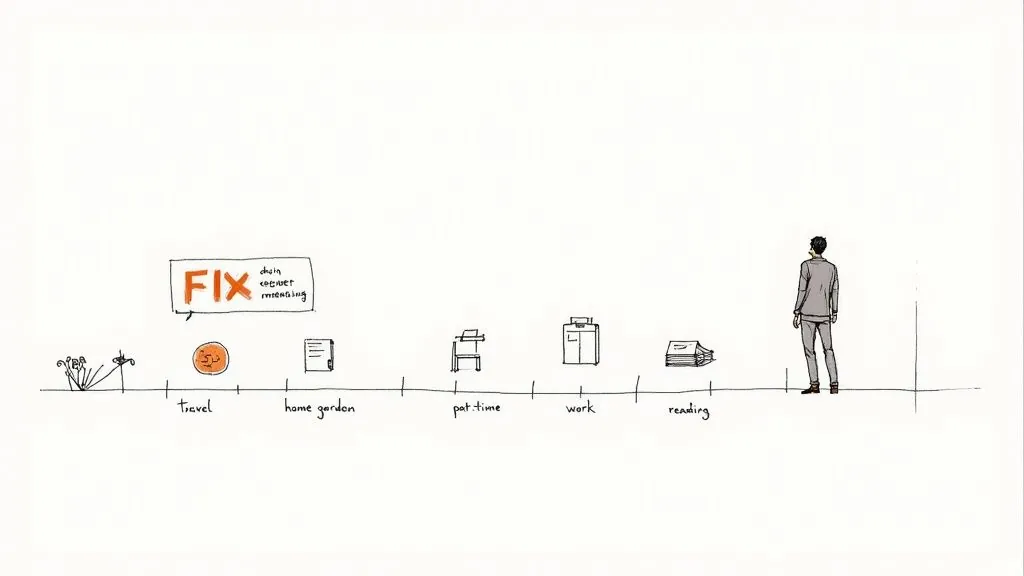
This isn’t about living a life of extreme deprivation. It’s about being incredibly intentional with the two most powerful levers you can pull: your income and your spending. Let’s break down how to attack both.
Supercharge Your Earning Potential
While cutting your expenses is non-negotiable, there’s a hard limit to how much you can possibly save. Your income, on the other hand, has a much, much higher ceiling. Boosting your earnings is the single fastest way to accelerate your journey to financial freedom.
Here are a few proven ways to do it:
- Negotiate a Raise: So many people undervalue themselves at work. Do your homework. Research your market value, document every single one of your accomplishments, and book a meeting with your boss to make a clear, data-backed case for a salary bump. A 10% raise on a $70,000 salary adds an extra $7,000 to your investment engine. Every. Single. Year.
- Develop a Scalable Side Hustle: Not all side hustles are created equal. Forget about trading more hours for dollars (like driving for a rideshare). Instead, focus on creating something that can scale—think an online course, an e-book, a niche blog, or a small e-commerce store. These are assets that can generate income even when you’re not actively working on them.
- Skill Up for a Higher-Paying Role: Look at the in-demand skills in your industry right now. Is it data analytics? Project management? Digital marketing? Go get those skills through certifications or online courses. This can set you up for a major pay increase or a completely new role at a different company.
The current economic landscape makes boosting income more critical than ever. A recent survey from Goldman Sachs Asset Management revealed that a staggering 42% of younger workers are living paycheck to paycheck, finding it almost impossible to save. These pressures are delaying major life milestones and making traditional retirement feel like a pipe dream for many.
Optimize Your Spending on the Big Three
Now for the other side of the equation: spending. Forget stressing over lattes. Focus your energy where it actually matters—the three areas that gobble up the biggest chunk of most budgets: housing, transportation, and food. Small wins here create absolutely massive, recurring savings.
Your goal goes beyond spending less; it is to design a lifestyle that is both fulfilling and low-cost. This intentionality is what separates successful early retirees from those who just dream about it.
Let’s run through a common scenario. Imagine a couple decides to downsize from a huge suburban house to a smaller, more centrally located condo. This single decision could slash their expenses in a big way:
- Lower Mortgage/Rent: Saving $800/month.
- Reduced Property Taxes and Insurance: Saving $250/month.
- Lower Utility Bills: Saving $150/month.
- Eliminating One Car: Saving $500/month on payments, insurance, gas, and maintenance.
Just like that, this one lifestyle shift frees up $1,700 per month. That’s $20,400 per year—a huge amount of capital that can now be put to work for you, compounding day after day, year after year.
Create Your Surplus and Automate Everything
Once you’ve widened the gap between what you earn and what you spend, the final piece of the puzzle is to make saving completely effortless. This is where automation becomes your secret weapon. The goal is simple: “pay yourself first.” You do this by setting up automatic transfers to your investment accounts the very moment your paycheck hits.
This takes willpower and decision fatigue completely out of the equation. You’re no longer deciding to save each month; it’s just happening in the background, like a utility bill. A crucial step in this process is knowing how to start investing as a beginner. By making your investments the very first “bill” you pay, you guarantee that your future is always your top priority.
Accelerate Your Wealth Through Smart Investing
Creating a big gap between what you earn and what you spend is a fantastic start, but you can’t just save your way to early retirement. You need your money to start working for you, pulling its own weight and growing even when you’re asleep. This is where smart investing enters the picture, turning your savings into a wealth-building engine that can power you toward financial freedom.
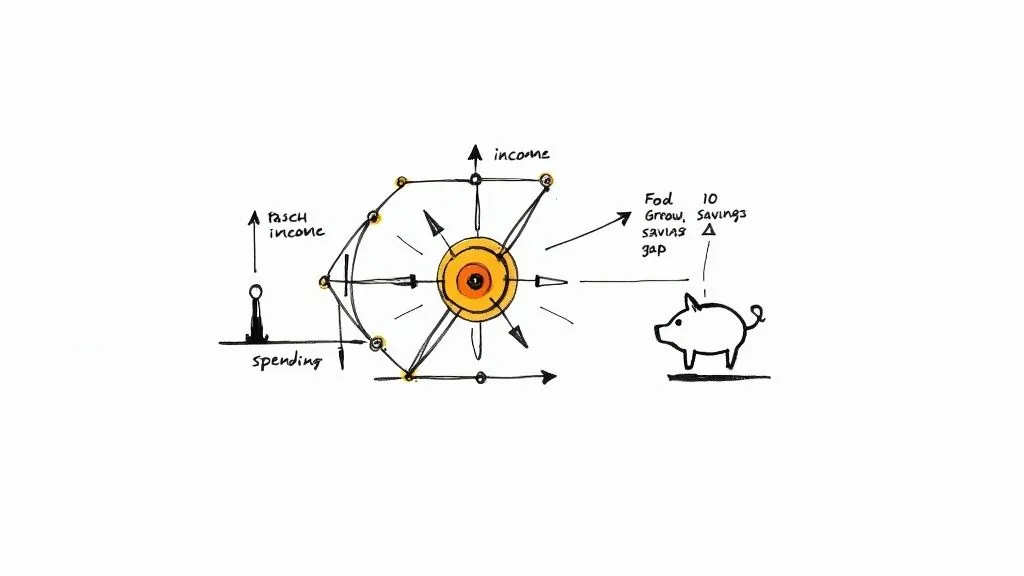
The goal here isn’t to become a stock market wizard. It’s to build a simple, effective, and automated system that does the heavy lifting for you. For most of us chasing early retirement, that means a core strategy built on low-cost index funds and Exchange-Traded Funds (ETFs).
These tools give you instant diversification by tracking major market indexes like the S&P 500. Historically, they deliver solid long-term returns without the sky-high fees that can quietly sabotage your portfolio’s growth.
First, Max Out Your Tax-Advantaged Accounts
Before you even think about putting a dollar into a standard brokerage account, you need to squeeze every drop of value out of your tax-advantaged retirement accounts. Think of these as your investment “superchargers,” designed to help your money grow faster by shielding it from the tax man.
The two heavy hitters here are:
- 401(k) or 403(b): This is your workplace retirement plan. If your company offers a match, contributing enough to get the full amount is the closest thing to “free money” you will ever find. Not doing this is like turning down a guaranteed 100% return on your money right out of the gate.
- Individual Retirement Arrangement (IRA): Whether you have a 401(k) or not, an IRA is a phenomenal tool. You can go with a Traditional IRA for a potential tax deduction now, or a Roth IRA, where you pay taxes upfront, and all your qualified withdrawals in retirement are 100% tax-free.
Many early retirement followers lean heavily into the Roth IRA. That tax-free growth becomes incredibly powerful when it compounds over decades. The concept is simple, but if you’re just starting, our complete guide on how to start investing money breaks down the fundamentals.
The core principle is simple: let compound interest work its magic in a tax-sheltered environment. Every dollar that isn’t siphoned off for taxes is another dollar that gets reinvested to grow, dramatically speeding up your timeline.
Comparing Investment Accounts For Early Retirement
Choosing the right accounts is just as important as choosing the right investments. Here’s a quick look at the common options and why the order you fund them in matters so much.
| Account Type | Tax Advantage | Contribution Limit (2024) | Early Withdrawal Rules |
|---|---|---|---|
| 401(k) | Pre-tax or Roth contributions, tax-deferred growth | $23,000 | Generally a 10% penalty before age 59.5, with some exceptions. |
| Traditional IRA | Contributions may be tax-deductible, tax-deferred growth | $7,000 | Subject to a 10% penalty before age 59.5, with exceptions. |
| Roth IRA | After-tax contributions, tax-free growth and withdrawals | $7,000 | Contributions can be withdrawn anytime penalty-free. Earnings are penalized before 59.5. |
| HSA | Triple tax-advantaged (tax-deductible, grows tax-free, tax-free withdrawals for medical) | $4,150 (Self) | Can be used penalty-free for non-medical expenses after age 65. |
| Brokerage Acct. | No tax advantages | No limit | No withdrawal rules, but you pay capital gains tax on profits. |
This table makes it clear why tax-advantaged accounts should be your top priority. The game plan is to fill these “buckets” every single year before letting any extra cash spill over into a standard taxable brokerage account. While some look to branch out into things like cash flow real estate investing for another income stream, mastering these accounts is the cornerstone for most early retirees.
The Roth Conversion Ladder: Your Key to Early Retirement Funds
One of the biggest puzzles for aspiring early retirees is how to get to their money before age 59.5 without getting slapped with a nasty 10% penalty. This is where a clever strategy called the Roth Conversion Ladder becomes your best friend.
Here’s the basic idea:
- Fund a Traditional 401(k)/IRA: While you’re working and in a higher tax bracket, you make pre-tax contributions.
- Convert a Portion to a Roth IRA: Once you retire (and are likely in a lower tax bracket), you “convert” a chunk of your traditional funds to a Roth IRA each year. You’ll pay regular income tax on the converted amount for that year.
- Wait Five Years: Each conversion starts its own five-year “seasoning” clock.
- Withdraw Tax-Free: After five years, you can pull out that specific converted amount—completely tax-free and penalty-free—no matter your age.
By “laddering” these conversions year after year, you create a reliable pipeline of tax-free cash to live on in your 40s or 50s. It’s a game-changing tactic that makes early retirement a real, workable plan by letting you tap into your biggest pile of savings without giving a huge chunk back in penalties.
Living the Dream: What Early Retirement Actually Looks Like
Crossing that financial independence finish line is an incredible feeling. But make no mistake, it’s not the end of the journey—it’s the start of a whole new phase. The game shifts from accumulating assets to preserving your wealth and, just as importantly, spending it wisely.
This is where the rubber meets the road. You’ll need to tackle the big, practical questions that keep a lot of aspiring early retirees up at night, especially when you no longer have a steady paycheck rolling in.

Crafting a robust plan for this new chapter is more critical than ever. Recent economic uncertainty has shaken things up. A report from State Street Global Advisors found there’s been an 8% drop in people planning to retire before 65. With market volatility and inflation spooking people, having a bulletproof strategy is non-negotiable. You can dig into their full US snapshot report to see how retirement expectations are changing.
Solving the Healthcare Puzzle
For anyone in the U.S. planning to retire early, one question looms larger than any other: what about healthcare? You’re likely decades away from being eligible for Medicare at age 65, so you absolutely need a plan to bridge that gap.
Thankfully, you’ve got a few solid options:
- Affordable Care Act (ACA) Marketplace: This is the go-to for most early retirees, and for good reason. Your premiums are based on your income (specifically, your Modified Adjusted Gross Income or MAGI), not your net worth. By carefully managing how much you withdraw each year, you can often qualify for huge subsidies that make excellent health plans surprisingly cheap.
- Health Sharing Ministries: These are faith-based groups where members chip in monthly to cover each other’s medical expenses. They aren’t traditional insurance and can have rules about pre-existing conditions, but they’re a lower-cost alternative that works well for some people.
- COBRA: This lets you stay on your old employer’s health plan for up to 18 months. It’s a seamless transition, but it’s brutally expensive since you have to pay the entire premium yourself, plus an administrative fee. Think of it as a pricey, short-term stopgap.
Bottom line: healthcare is a major, recurring expense. You have to factor it into your annual budget to make sure your retirement plan holds up.
Mastering Your Withdrawal Strategy
The 4% Rule is a fantastic starting point, but it’s not a “set it and forget it” solution. An early retirement could last 40, 50, or even 60 years. Sticking to a rigid withdrawal plan, especially during a nasty market downturn, could put your entire nest egg in jeopardy.
The goal of a flexible withdrawal strategy goes beyond making your money last; it is to give you peace of mind. By building in adaptability, you can weather market storms without panicking or jeopardizing your long-term financial security.
A popular and effective method is the guardrail strategy. It’s all about setting upper and lower boundaries for your withdrawal rate. For example, if your portfolio has a killer year and your withdrawal rate drops below 3%, you might give yourself a 10% raise. On the flip side, if a market crash shoves your withdrawal rate above 5%, you’d trim your spending by 10% until things bounce back. It automates common-sense adjustments and protects your portfolio when it’s most vulnerable.
Defeating the Sequence of Returns Risk
The single biggest boogeyman for a new early retiree is sequence of returns risk. This is the danger of hitting a major market downturn right after you stop working. When you’re forced to withdraw money from a portfolio that’s simultaneously tanking in value, it can permanently damage its ability to recover.
Imagine retiring with $1 million just before a recession hits. If your portfolio drops to $700,000 but you still need to pull out $40,000 to live on, you’re suddenly taking out a much bigger slice of the pie. This can kick off a downward spiral that’s incredibly hard to pull out of.
Here’s how you fight back against this risk:
- Keep a Cash Buffer: Have one to two years’ worth of living expenses sitting in a high-yield savings account. If the market implodes, you live off this cash instead of selling your investments at rock-bottom prices. This gives your portfolio the breathing room it needs to recover.
- Use a Bucket Strategy: Mentally sort your money into different “buckets.” Bucket one is cash for 1-2 years of spending. Bucket two is bonds for 3-10 years of expenses. And bucket three is stocks for long-term growth. This structure helps you sleep at night, knowing your immediate needs are covered no matter what the market is doing.
How to Track and Adapt Your Retirement Plan
Your plan to retire early isn’t a static blueprint you create once and then shove in a drawer. Think of it as a living, breathing document that has to evolve with your life and the markets. Consistently tracking your progress and making smart adjustments is what separates a successful early retirement from a plan that just fizzles out.
It’s a lot like navigating a long voyage. You wouldn’t just point your ship in the right direction and hope for the best. You’d be constantly checking your compass, monitoring the weather, and adjusting your sails. The same exact principle applies to your financial journey.
Choosing Your Financial Dashboard
First things first: you need a clear, real-time picture of your financial health. A simple spreadsheet can work, sure, but modern tools offer a far more powerful—and motivating—experience by pulling everything into a single, easy-to-read dashboard.
Here’s a quick rundown of your main options:
- Manual Spreadsheets: The classic DIY approach. You get total control, but it requires diligent manual updates and can get messy as your finances grow more complex.
- Brokerage-Specific Tools: Most investment platforms have basic tracking, but they only show you one piece of the puzzle—the assets you hold with them.
- Dedicated Net Worth Trackers: A tracker can hold a recurring balance-sheet snapshot. In PopaDex, Standard records assets and debts manually in one consistent currency; Premium adds ongoing original-currency records and optional connections where the exact institution and account type are supported. Real estate and other manual assets still need source-based updates.
Here’s an example of how a clean, consolidated view can bring some much-needed clarity.
Seeing all your assets and liabilities in one place transforms abstract numbers into a tangible measure of progress. Honestly, it’s a massive motivator. This consolidated view lets you instantly see if you’re on track to hit your financial independence number.
The Annual Financial Check-Up
Your dashboard gives you the daily view, but you also need to set aside time to zoom out and look at the bigger picture. An annual financial check-up is a non-negotiable ritual for anyone serious about early retirement. This is your chance to review, reassess, and recalibrate your strategy.
During this annual review, you should focus on a few key areas:
- Revisit Your Goals: Does your original retirement vision still feel right? A year can bring huge life changes—a new family member, a career shift, or just a change in priorities—that might require adjusting your target lifestyle and FI number.
- Analyze Your Savings Rate: Did you hit your savings target for the year? If not, why? Digging into the details can help you spot spending leaks or identify opportunities to boost your income in the year ahead.
- Review Your Investment Performance: Check your asset allocation. Make sure it still aligns with your risk tolerance. This is also the perfect time to rebalance your portfolio—selling some of your winners and buying more of your underperformers to get back to your desired mix.
Your early retirement plan has to be resilient enough to absorb life’s surprises. An annual check-up isn’t about judging past performance; it’s about proactively steering your future toward your ultimate goal of freedom.
Adapting to a Changing World
Finally, your plan must account for the external factors you can’t control. Globally, the entire landscape of retirement is shifting. OECD data shows that the average early retirement age is projected to climb from 62.5 to 63.9 years as governments adjust policies for longer lifespans and pension sustainability. This trend just highlights the growing importance of having a robust, self-funded plan that isn’t completely reliant on traditional systems. You can dive into the full ‘Pensions at a Glance’ report to understand how retirement ages are changing worldwide.
This means you have to be ready to pivot. If inflation runs hotter than expected for a few years, you might need to adjust your withdrawal strategy or even consider some part-time work you actually enjoy. Use the FIRE calculator methodology to see how return, inflation, and withdrawal assumptions affect the estimate before testing your own numbers.
By staying informed and flexible, you ensure your plan stays on track, no matter what curveballs life decides to throw your way.
Common Questions About Retiring Early
The road to financial independence brings up a lot of questions. As you start putting your plan into action, you’re bound to run into some “what-ifs.” Getting solid answers is the best way to stay on track and make smart moves with your money.
Think of this as your go-to guide for the most common curiosities that pop up on the journey to an early retirement.
How Much Money Do You Really Need to Retire Early?
There’s no magic number here—it’s completely personal and depends on the life you want to live. The most common starting point is the “25x rule,” which suggests you need to save 25 times your planned annual spending.
So, if you think you’ll live on $60,000 a year, your target is $1.5 million. This math is built on the 4% withdrawal rate, a long-standing guideline for how much you can safely take from your portfolio each year.
But many early retirees play it safer. Shifting to a 3.5% withdrawal rate (which means you’d need about 28.5x your annual expenses) gives you a much bigger cushion against a bad market or unexpected healthcare bills down the road.
What Are the Biggest Non-Financial Challenges of Early Retirement?
We spend so much time on the numbers that we often forget about the mental and social side of things, which can be just as tough. For many, a career is a huge part of their identity. When that suddenly goes away, it can leave a real void.
The goal goes beyond retiring from something, like a job. The goal is to retire to something—a life filled with purpose, community, and activities you genuinely enjoy.
The key is to start building that new life before you quit your job. That means digging into hobbies, volunteering, or finding social groups outside of work. The jump from a structured 9-to-5 to total freedom can be jarring, so preparing for that psychological shift is every bit as important as funding your 401(k).
Can I Still Earn Money After I Retire?
Absolutely! And you’d be surprised how many early retirees do. Hitting financial independence doesn’t mean you can never earn another dollar. It just means you don’t have to work to cover your living expenses.
Many people ease into what’s known as “Barista FIRE” or “Coast FIRE,” where they pick up enjoyable, low-stress work on their own terms. This could be anything:
- Part-time consulting in your old field, but only on projects you find interesting.
- Turning a passion like woodworking or photography into a small side business.
- Working a few shifts at a local brewery just for the social vibe and extra cash.
This extra income is a powerful buffer. It lets you pull less from your investments, covers fun expenses without a second thought, and keeps you active and engaged. The best part? It’s completely optional and entirely on your schedule.
How Do I Protect My Nest Egg From Inflation and Market Crashes?
Once you’re living off your portfolio, protecting what you’ve built is job number one. Your best long-term defense against inflation is a diversified mix of assets that historically beat it, like stocks and real estate.
But you also need a plan for market crashes, especially in those first few critical years of retirement (this is called sequence of returns risk).
- Keep a Cash Buffer: Have 1-2 years of living expenses parked in a high-yield savings account. This lets you pay your bills with cash during a downturn instead of being forced to sell your stocks when they’re down.
- Stay Flexible on Withdrawals: Be ready to tighten your belt a bit if the market takes a big hit. Pulling back on spending prevents you from draining your portfolio when it’s most vulnerable.
- Use a Bucket Strategy: Divide your money into different “buckets” for short-term, medium-term, and long-term needs. This framework ensures the money you need for next month’s bills is always safe and sound.
Diversification and flexibility are your best friends for riding out the market’s inevitable ups and downs, making sure your nest egg is there for you for decades.
Once you have a target, use the PopaDex FIRE tracker app to connect that goal to your current net worth, savings rate, and estimated financial-independence date.
Ready to build a dated net-worth snapshot? PopaDex lets you record assets and debts manually in one consistent currency on Standard. Premium adds ongoing records across original currencies and optional connections where the exact institution and account type are supported. Start with free manual tracking.
Early-retirement calculator assumptions
Estimate annual spending after leaving work, include healthcare and taxes, and subtract reliable income that will continue. Divide the portfolio-funded amount by a chosen starting withdrawal rate to get a rough target, then stress-test returns, inflation, and a long retirement. For instance, $40,000 funded from investments at 4% suggests a $1,000,000 starting portfolio before taxes and fees. This is an illustration, not a safe-withdrawal guarantee.
Use the working FIRE calculator to vary assumptions and track progress. Revisit the plan when household size, country, costs, or pension rules change.